29
/pt/
pt
AIzaSyAYiBZKx7MnpbEhh9jyipgxe19OcubqV5w
April 1, 2024
88283
Bosnia and Herzegovina
BIH
true
2
1
Claims on other sectors of the domestic economy (% of GDP)
2016,2015,2014,2013,2012,2011,2010,2009,2008,2007,2006,2005,2004,2003,2002
Download
Biblioteca de estatísticas globais →Bosnia and Herzegovina →

Claims on other sectors of the domestic economy (% of GDP)

Estas estatísticas em outros países:
AfghanistanAlbaniaAlgeriaAngolaAntigua and BarbudaArmeniaAustraliaAustriaAzerbaijanBangladeshBarbadosBelarusBelgiumBelizeBeninBhutanBoliviaBosnia and HerzegovinaBotswanaBrazilBrunei DarussalamBulgariaBurkina FasoBurundiCabo VerdeCambodiaCameroonCanadaCaribbean small statesCentral African RepublicCentral Europe and the BalticsChadChileColombiaComorosCongo, Dem. Rep.Congo, Rep.Costa RicaCote d'IvoireCroatiaCyprusCzech RepublicDenmarkDominicaDominican RepublicEast Asia & PacificEcuadorEgypt, Arab Rep.El SalvadorEquatorial GuineaEritreaEstoniaEuro areaEurope & Central AsiaEurope & Central Asia (excluding high income)Europe & Central Asia (IDA & IBRD countries)European UnionFijiFinlandFragile and conflict affected situationsFranceGabonGambia, TheGeorgiaGermanyGhanaGreeceGrenadaGuatemalaGuinea-BissauGuyanaHaitiHeavily indebted poor countries (HIPC)High incomeHondurasHungaryIcelandIDA blendIDA onlyIDA totalIndonesiaIraqIrelandIsraelItalyJamaicaJapanKazakhstanKenyaKorea, Rep.KosovoKuwaitKyrgyz RepublicLatin America & Caribbean Latin America & Caribbean (excluding high income)Latin America & the Caribbean (IDA & IBRD countries)LatviaLeast developed countries: UN classificationLesothoLithuaniaLow incomeLuxembourgMacao SAR, ChinaMacedonia, FYRMalaysiaMaldivesMaliMaltaMauritiusMexicoMiddle East & North AfricaMiddle East & North Africa (excluding high income)Middle East & North Africa (IDA & IBRD countries)MoldovaMongoliaMoroccoMozambiqueMyanmarNamibiaNepalNetherlandsNicaraguaNigerNigeriaNorth AmericaNorwayOECD membersOmanOther small statesPacific island small statesPakistanPanamaPapua New GuineaParaguayPhilippinesPolandPortugalPost-demographic dividendPre-demographic dividendQatarRomaniaRussian FederationRwandaSamoaSao Tome and PrincipeSenegalSerbiaSeychellesSierra LeoneSlovak RepublicSloveniaSmall statesSolomon IslandsSouth AfricaSouth SudanSpainSri LankaSt. Kitts and NevisSt. LuciaSt. Vincent and the GrenadinesSub-Saharan Africa Sub-Saharan Africa (excluding high income)Sub-Saharan Africa (IDA & IBRD countries)SudanSurinameSwazilandSwedenSyrian Arab RepublicTajikistanTanzaniaThailandTimor-LesteTogoTongaTrinidad and TobagoTurkeyUgandaUkraineUnited Arab EmiratesUnited StatesUruguayVanuatuVenezuela, RBWest Bank and GazaWorldZambia
Linha do tempo:
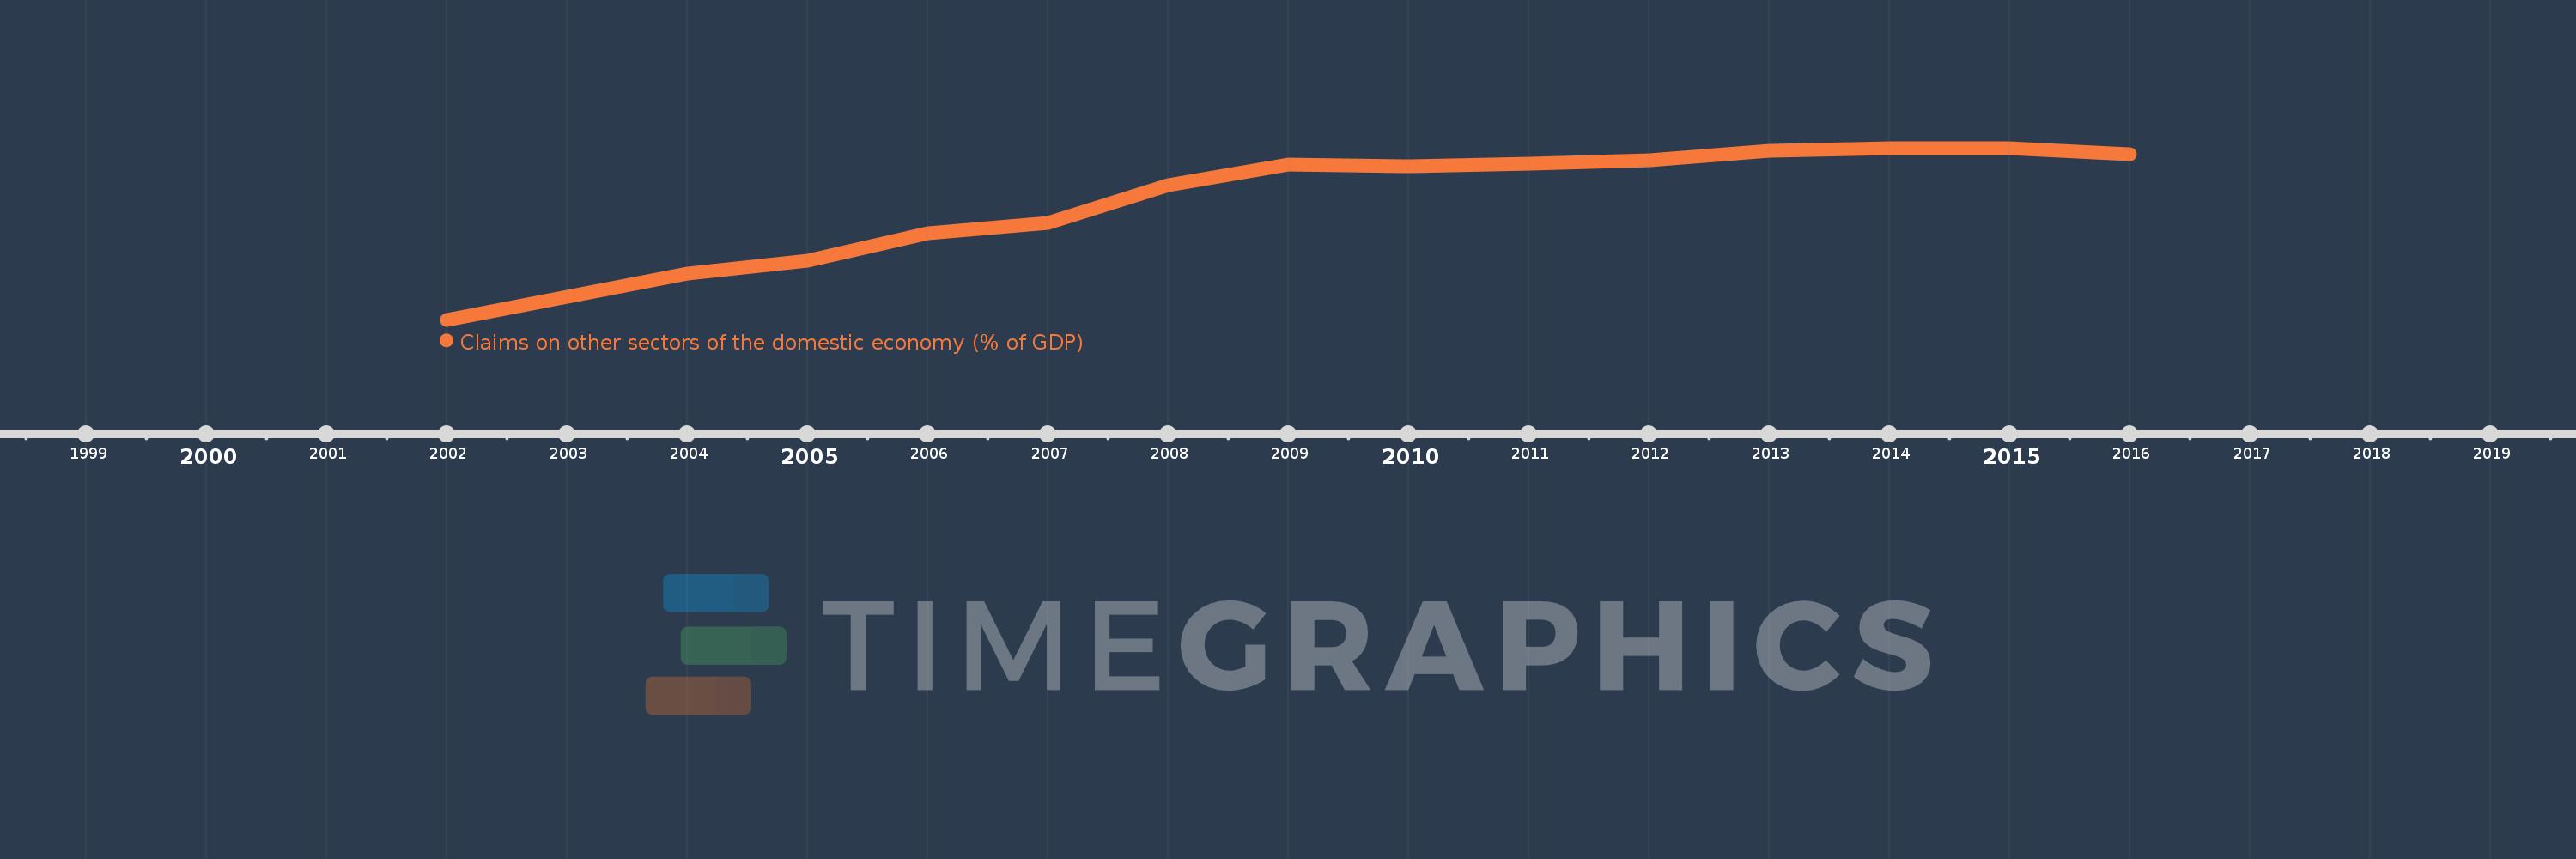
Nesta escala de tempo está apresentado um gráfico de 2002 ano até 2016 ano Bosnia and Herzegovina. Dados de 2001 ano ausente. O número de observações reais por data: 15.
Fonte (nome):
Indicadores de desenvolvimento mundial
Fonte (organização):
International Monetary Fund, International Financial Statistics and data files, and World Bank and OECD GDP estimates.
Categorias:
Financial Sector
Foi atualizado:
23 abr 2017 ano
Indicadores de alterações dos valores ao longo dos anos
Em média:
48.203
Mínimo:
26.487
1 jan 2002 ano
Máximo:
58.483
1 jan 2015 ano
Na data de observação
Valor
Mudança absoluta
A alteração em relação ao valor anterior
1 jan 2002 ano
26.487
+26.487
0.0%
1 jan 2003 ano
30.704
+4.217
15.92%
1 jan 2004 ano
35.147
+4.443
14.47%
1 jan 2005 ano
37.423
+2.276
6.48%
1 jan 2006 ano
42.638
+5.214
13.93%
1 jan 2007 ano
44.55
+1.913
4.49%
1 jan 2008 ano
51.615
+7.064
15.86%
1 jan 2009 ano
55.402
+3.788
7.34%
1 jan 2010 ano
55.127
-0.275
-0.5%
1 jan 2011 ano
55.598
+0.471
0.85%
1 jan 2012 ano
56.141
+0.543
0.98%
1 jan 2013 ano
58.025
+1.884
3.36%
1 jan 2014 ano
58.451
+0.426
0.73%
1 jan 2015 ano
58.483
+0.032
0.05%
1 jan 2016 ano
57.253
-1.23
-2.1%
Classificação de países por estatísticas atuais por anos

Comentários:

Enviar
PremiumAbout & FeedbackAcordoPrivacidade
logo
© 2022 Selected Technologies LLC – Morgan Hill, California