33
/pt/
AIzaSyAYiBZKx7MnpbEhh9jyipgxe19OcubqV5w
August 1, 2025
187535
Malaysia
MYS
true
2
1
Claims on other sectors of the domestic economy (% of GDP)
2016,2015,2014,2013,2012,2011,2010,2009,2008,2007,2006,2005,2004,2003,2002
Download
Biblioteca de estatísticas globais →Malaysia →

Claims on other sectors of the domestic economy (% of GDP)

Estas estatísticas em outros países:

AfghanistanAlbaniaAlgeriaAngolaAntigua and BarbudaArmeniaAustraliaAustriaAzerbaijanBangladeshBarbadosBelarusBelgiumBelizeBeninBhutanBoliviaBosnia and HerzegovinaBotswanaBrazilBrunei DarussalamBulgariaBurkina FasoBurundiCabo VerdeCambodiaCameroonCanadaCaribbean small statesCentral African RepublicCentral Europe and the BalticsChadChileColombiaComorosCongo, Dem. Rep.Congo, Rep.Costa RicaCote d'IvoireCroatiaCyprusCzech RepublicDenmarkDominicaDominican RepublicEast Asia & PacificEcuadorEgypt, Arab Rep.El SalvadorEquatorial GuineaEritreaEstoniaEuro areaEurope & Central AsiaEurope & Central Asia (excluding high income)Europe & Central Asia (IDA & IBRD countries)European UnionFijiFinlandFragile and conflict affected situationsFranceGabonGambia, TheGeorgiaGermanyGhanaGreeceGrenadaGuatemalaGuinea-BissauGuyanaHaitiHeavily indebted poor countries (HIPC)High incomeHondurasHungaryIcelandIDA blendIDA onlyIDA totalIndonesiaIraqIrelandIsraelItalyJamaicaJapanKazakhstanKenyaKorea, Rep.KosovoKuwaitKyrgyz RepublicLatin America & Caribbean Latin America & Caribbean (excluding high income)Latin America & the Caribbean (IDA & IBRD countries)LatviaLeast developed countries: UN classificationLesothoLithuaniaLow incomeLuxembourgMacao SAR, ChinaMacedonia, FYRMalaysiaMaldivesMaliMaltaMauritiusMexicoMiddle East & North AfricaMiddle East & North Africa (excluding high income)Middle East & North Africa (IDA & IBRD countries)MoldovaMongoliaMoroccoMozambiqueMyanmarNamibiaNepalNetherlandsNicaraguaNigerNigeriaNorth AmericaNorwayOECD membersOmanOther small statesPacific island small statesPakistanPanamaPapua New GuineaParaguayPhilippinesPolandPortugalPost-demographic dividendPre-demographic dividendQatarRomaniaRussian FederationRwandaSamoaSao Tome and PrincipeSenegalSerbiaSeychellesSierra LeoneSlovak RepublicSloveniaSmall statesSolomon IslandsSouth AfricaSouth SudanSpainSri LankaSt. Kitts and NevisSt. LuciaSt. Vincent and the GrenadinesSub-Saharan Africa Sub-Saharan Africa (excluding high income)Sub-Saharan Africa (IDA & IBRD countries)SudanSurinameSwazilandSwedenSyrian Arab RepublicTajikistanTanzaniaThailandTimor-LesteTogoTongaTrinidad and TobagoTurkeyUgandaUkraineUnited Arab EmiratesUnited StatesUruguayVanuatuVenezuela, RBWest Bank and GazaWorldZambia

Linha do tempo:

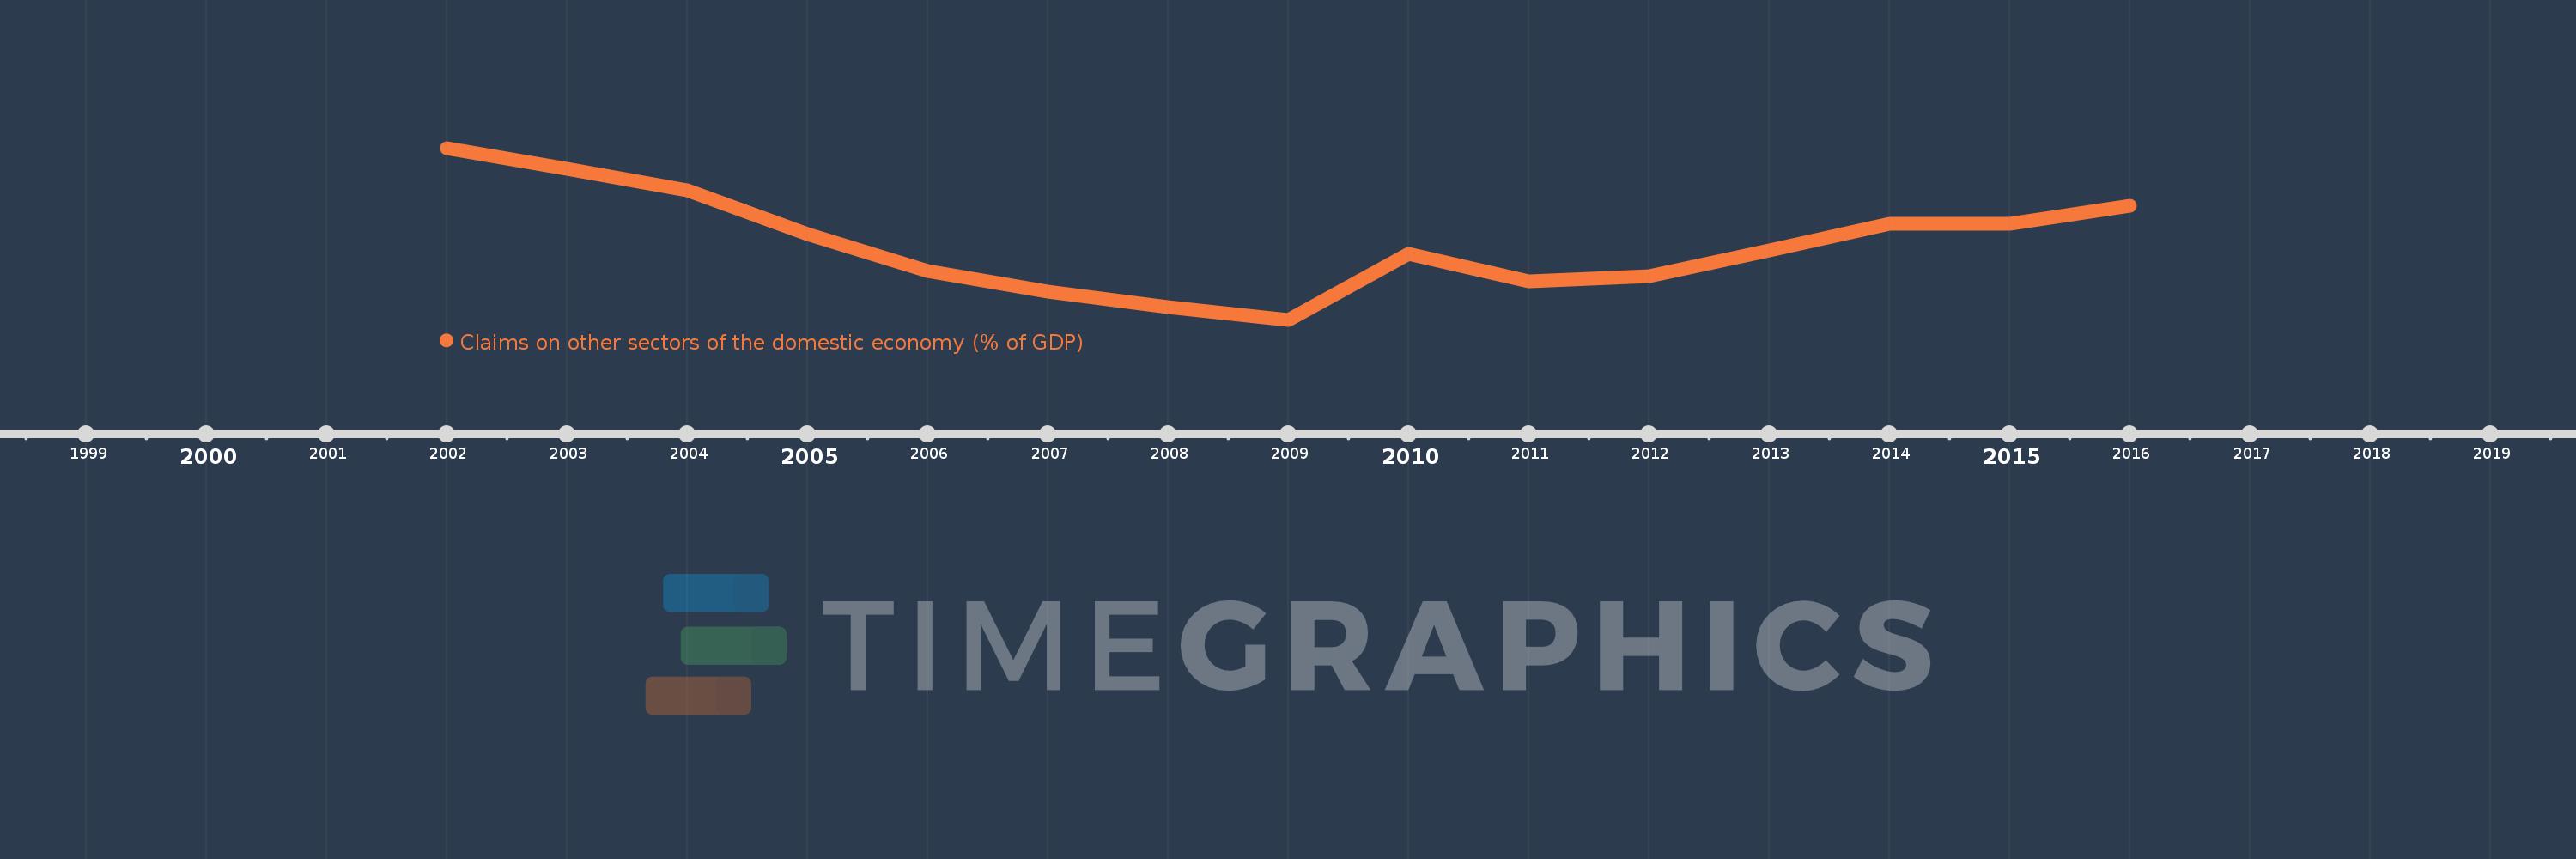
Nesta escala de tempo está apresentado um gráfico de 2002 ano até 2016 ano Malaysia. Dados de 2001 ano ausente. O número de observações reais por data: 15.

Fonte (nome):

Indicadores de desenvolvimento mundial

Fonte (organização):

International Monetary Fund, International Financial Statistics and data files, and World Bank and OECD GDP estimates.

Categorias:

Financial Sector

Foi atualizado:

23 abr 2017 ano

Indicadores de alterações dos valores ao longo dos anos

Em média:
126.713
Mínimo:
108.351
1 jan 2009 ano
Máximo:
149.489
1 jan 2002 ano
Na data de observação
Valor
Mudança absoluta
A alteração em relação ao valor anterior
1 jan 2002 ano
149.489
+149.489
0.0%
1 jan 2003 ano
144.488
-5.001
-3.35%
1 jan 2004 ano
139.366
-5.122
-3.54%
1 jan 2005 ano
128.944
-10.422
-7.48%
1 jan 2006 ano
119.972
-8.972
-6.96%
1 jan 2007 ano
115.052
-4.92
-4.1%
1 jan 2008 ano
111.353
-3.699
-3.22%
1 jan 2009 ano
108.351
-3.003
-2.7%
1 jan 2010 ano
124.123
+15.772
14.56%
1 jan 2011 ano
117.543
-6.579
-5.3%
1 jan 2012 ano
118.792
+1.249
1.06%
1 jan 2013 ano
124.855
+6.063
5.1%
1 jan 2014 ano
131.26
+6.405
5.13%
1 jan 2015 ano
131.383
+0.123
0.09%
1 jan 2016 ano
135.726
+4.343
3.31%

Classificação de países por estatísticas atuais por anos