33
/pt/
AIzaSyAYiBZKx7MnpbEhh9jyipgxe19OcubqV5w
August 1, 2025
77436
Bahrain
BHR
true
2
1
Net ODA received (% of GNI)
2005,2004,2003,2002,2001,2000,1999,1998,1997,1996,1995,1994,1993,1992,1991,1990,1989,1988,1987,1986,1985,1984,1983,1982,1981
Download
Biblioteca de estatísticas globais →Bahrain →

Net ODA received (% of GNI)

Estas estatísticas em outros países:

AfghanistanAlbaniaAlgeriaAngolaAntigua and BarbudaArab WorldArgentinaArmeniaAzerbaijanBahamas, TheBahrainBangladeshBarbadosBelarusBelizeBeninBermudaBhutanBoliviaBosnia and HerzegovinaBotswanaBrazilBrunei DarussalamBurkina FasoBurundiCabo VerdeCambodiaCameroonCaribbean small statesCentral African RepublicCentral Europe and the BalticsChadChileChinaColombiaComorosCongo, Dem. Rep.Congo, Rep.Costa RicaCote d'IvoireCroatiaCubaCyprusDjiboutiDominicaDominican RepublicEast Asia & PacificEast Asia & Pacific (excluding high income)East Asia & Pacific (IDA & IBRD countries)EcuadorEgypt, Arab Rep.El SalvadorEquatorial GuineaEritreaEthiopiaEuro areaEurope & Central AsiaEurope & Central Asia (excluding high income)Europe & Central Asia (IDA & IBRD countries)European UnionFijiFragile and conflict affected situationsFrench PolynesiaGabonGambia, TheGeorgiaGhanaGrenadaGuatemalaGuineaGuinea-BissauGuyanaHaitiHeavily indebted poor countries (HIPC)High incomeHondurasHong Kong SAR, ChinaIBRD onlyIDA & IBRD totalIDA blendIDA onlyIDA totalIndiaIndonesiaIran, Islamic Rep.IraqIsraelJamaicaJordanKazakhstanKenyaKiribatiKorea, Rep.KosovoKuwaitKyrgyz RepublicLao PDRLatin America & Caribbean Latin America & Caribbean (excluding high income)Latin America & the Caribbean (IDA & IBRD countries)Least developed countries: UN classificationLebanonLesothoLiberiaLibyaLow & middle incomeLow incomeLower middle incomeMacao SAR, ChinaMacedonia, FYRMadagascarMalawiMalaysiaMaldivesMaliMaltaMarshall IslandsMauritaniaMauritiusMexicoMicronesia, Fed. Sts.Middle East & North AfricaMiddle East & North Africa (excluding high income)Middle East & North Africa (IDA & IBRD countries)Middle incomeMoldovaMongoliaMontenegroMoroccoMozambiqueMyanmarNamibiaNauruNepalNew CaledoniaNicaraguaNigerNigeriaNorth AmericaOECD membersOmanOther small statesPacific island small statesPakistanPalauPanamaPapua New GuineaParaguayPeruPhilippinesQatarRwandaSamoaSao Tome and PrincipeSaudi ArabiaSenegalSerbiaSeychellesSierra LeoneSingaporeSloveniaSmall statesSolomon IslandsSomaliaSouth AfricaSouth AsiaSouth Asia (IDA & IBRD)South SudanSri LankaSt. Kitts and NevisSt. LuciaSt. Vincent and the GrenadinesSub-Saharan Africa Sub-Saharan Africa (excluding high income)Sub-Saharan Africa (IDA & IBRD countries)SudanSurinameSwazilandSyrian Arab RepublicTajikistanTanzaniaThailandTimor-LesteTogoTongaTrinidad and TobagoTunisiaTurkeyTurkmenistanTuvaluUgandaUkraineUpper middle incomeUruguayUzbekistanVanuatuVenezuela, RBVietnamWest Bank and GazaWorldYemen, Rep.ZambiaZimbabwe

Linha do tempo:

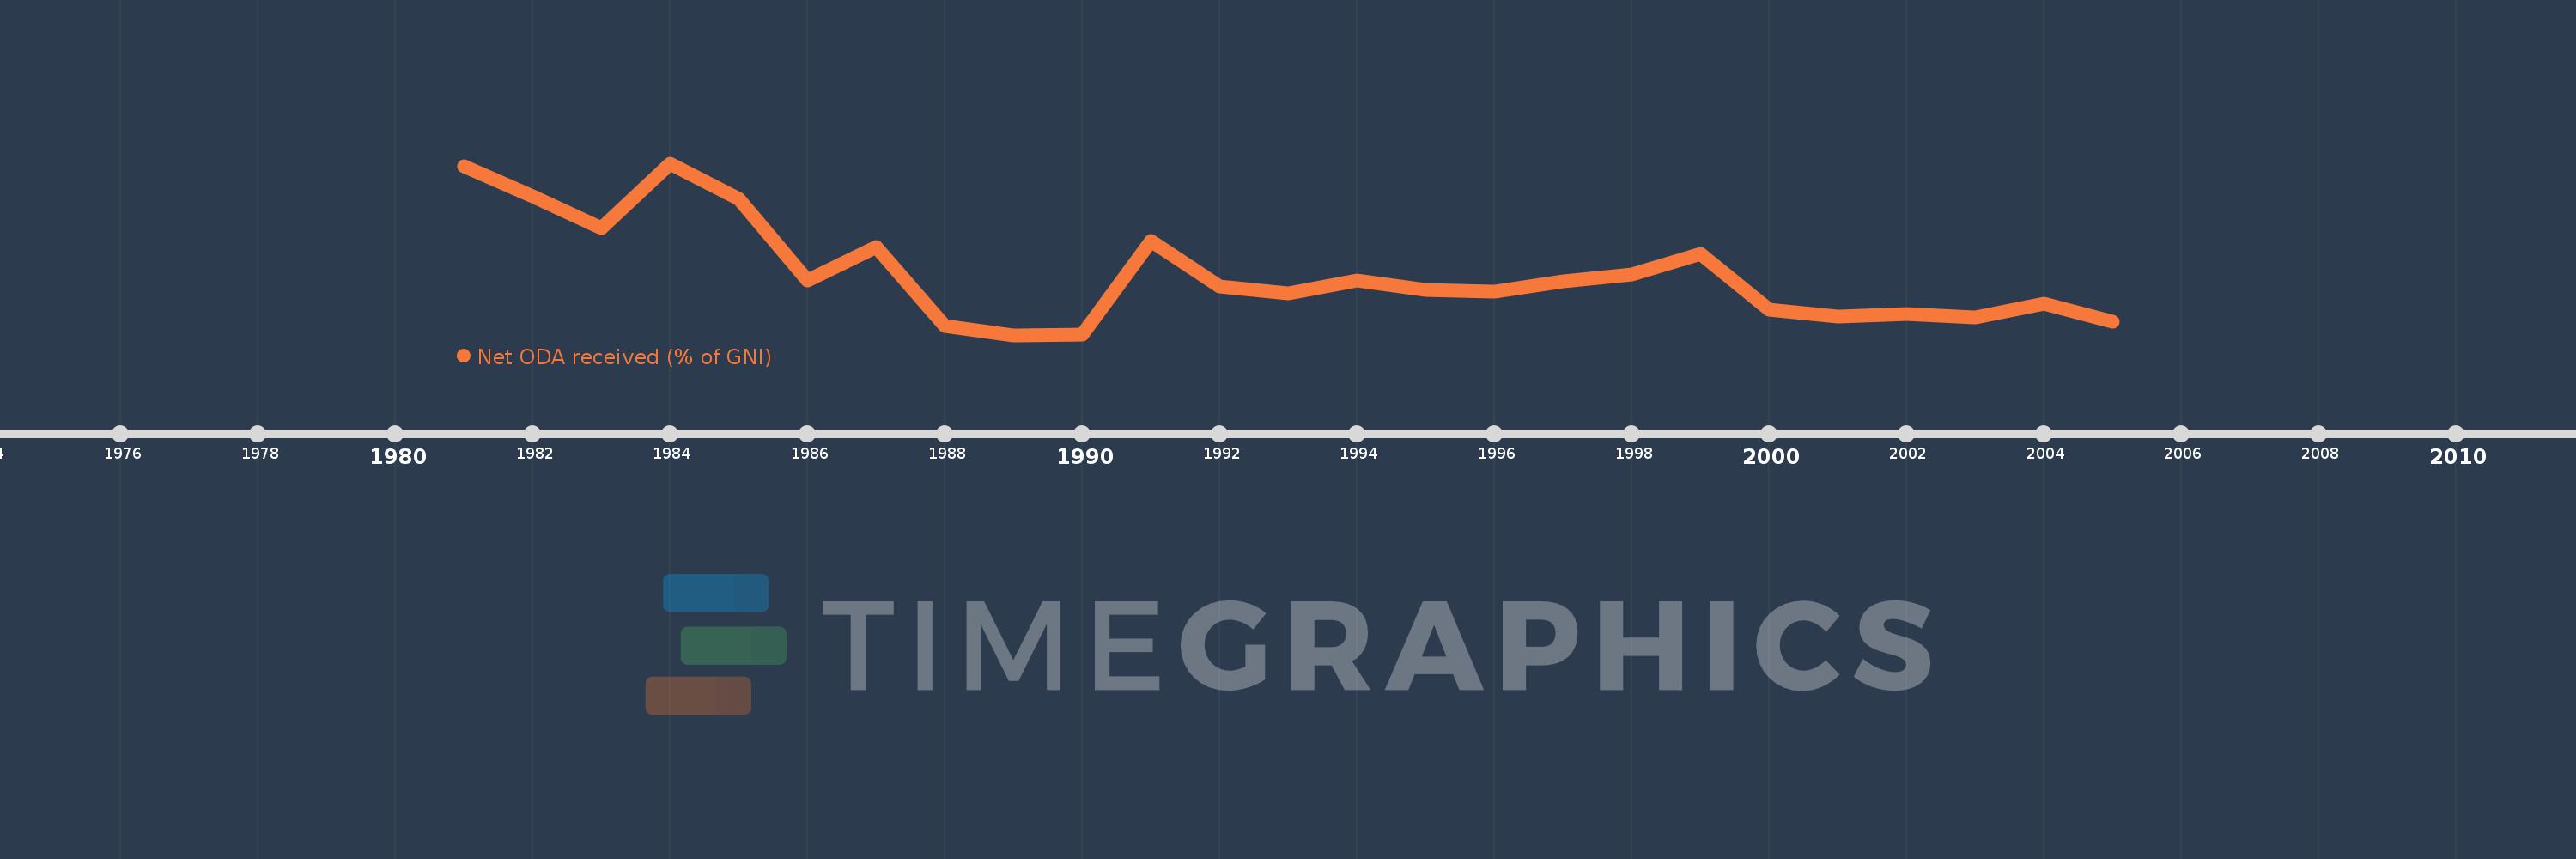
Nesta escala de tempo está apresentado um gráfico de 1981 ano até 2005 ano Bahrain. Dados de 1980 ano ausente. O número de observações reais por data: 25.

Fonte (nome):

Indicadores de desenvolvimento mundial

Fonte (organização):

Development Assistance Committee of the Organisation for Economic Co-operation and Development, Geographical Distribution of Financial Flows to Developing Countries, Development Co-operation Report, and International Development Statistics database. Data are available online at: www.oecd.org/dac/stats/idsonline. World Bank GNI estimates are used for the denominator.

Categorias:

Aid Effectiveness, Economy & Growth, External Debt

Foi atualizado:

23 abr 2017 ano

Indicadores de alterações dos valores ao longo dos anos

Em média:
2.48
Mínimo:
-0.082
1 jan 1989 ano
Máximo:
7.145
1 jan 1984 ano
Na data de observação
Valor
Mudança absoluta
A alteração em relação ao valor anterior
1 jan 1981 ano
7.003
+7.003
0.0%
1 jan 1982 ano
5.752
-1.252
-17.87%
1 jan 1983 ano
4.401
-1.351
-23.48%
1 jan 1984 ano
7.145
+2.744
62.36%
1 jan 1985 ano
5.629
-1.517
-21.23%
1 jan 1986 ano
2.204
-3.424
-60.84%
1 jan 1987 ano
3.633
+1.429
64.84%
1 jan 1988 ano
0.29
-3.343
-92.01%
1 jan 1989 ano
-0.082
-0.372
-128.31%
1 jan 1990 ano
-0.053
+0.029
-35.87%
1 jan 1991 ano
3.882
+3.934
-7.47 mil%
1 jan 1992 ano
1.97
-1.912
-49.25%
1 jan 1993 ano
1.675
-0.295
-14.97%
1 jan 1994 ano
2.226
+0.551
32.87%
1 jan 1995 ano
1.799
-0.427
-19.18%
1 jan 1996 ano
1.725
-0.074
-4.11%
1 jan 1997 ano
2.178
+0.453
26.25%
1 jan 1998 ano
2.458
+0.281
12.9%
1 jan 1999 ano
3.316
+0.858
34.91%
1 jan 2000 ano
0.974
-2.342
-70.62%
1 jan 2001 ano
0.684
-0.291
-29.84%
1 jan 2002 ano
0.818
+0.135
19.68%
1 jan 2003 ano
0.676
-0.142
-17.36%
1 jan 2004 ano
1.245
+0.569
84.16%
1 jan 2005 ano
0.463
-0.782
-62.82%

Classificação de países por estatísticas atuais por anos