33
/pt/
AIzaSyAYiBZKx7MnpbEhh9jyipgxe19OcubqV5w
May 1, 2025
261297
Tanzania
TZA
true
2
1
Net ODA received (% of GNI)
2015,2014,2013,2012,2011,2010,2009,2008,2007,2006,2005,2004,2003,2002,2001,2000,1999,1998,1997,1996,1995,1994,1993,1992,1991,1990,1989
Download
Biblioteca de estatísticas globais →Tanzania →

Net ODA received (% of GNI)

Estas estatísticas em outros países:

AfghanistanAlbaniaAlgeriaAngolaAntigua and BarbudaArab WorldArgentinaArmeniaAzerbaijanBahamas, TheBahrainBangladeshBarbadosBelarusBelizeBeninBermudaBhutanBoliviaBosnia and HerzegovinaBotswanaBrazilBrunei DarussalamBurkina FasoBurundiCabo VerdeCambodiaCameroonCaribbean small statesCentral African RepublicCentral Europe and the BalticsChadChileChinaColombiaComorosCongo, Dem. Rep.Congo, Rep.Costa RicaCote d'IvoireCroatiaCubaCyprusDjiboutiDominicaDominican RepublicEast Asia & PacificEast Asia & Pacific (excluding high income)East Asia & Pacific (IDA & IBRD countries)EcuadorEgypt, Arab Rep.El SalvadorEquatorial GuineaEritreaEthiopiaEuro areaEurope & Central AsiaEurope & Central Asia (excluding high income)Europe & Central Asia (IDA & IBRD countries)European UnionFijiFragile and conflict affected situationsFrench PolynesiaGabonGambia, TheGeorgiaGhanaGrenadaGuatemalaGuineaGuinea-BissauGuyanaHaitiHeavily indebted poor countries (HIPC)High incomeHondurasHong Kong SAR, ChinaIBRD onlyIDA & IBRD totalIDA blendIDA onlyIDA totalIndiaIndonesiaIran, Islamic Rep.IraqIsraelJamaicaJordanKazakhstanKenyaKiribatiKorea, Rep.KosovoKuwaitKyrgyz RepublicLao PDRLatin America & Caribbean Latin America & Caribbean (excluding high income)Latin America & the Caribbean (IDA & IBRD countries)Least developed countries: UN classificationLebanonLesothoLiberiaLibyaLow & middle incomeLow incomeLower middle incomeMacao SAR, ChinaMacedonia, FYRMadagascarMalawiMalaysiaMaldivesMaliMaltaMarshall IslandsMauritaniaMauritiusMexicoMicronesia, Fed. Sts.Middle East & North AfricaMiddle East & North Africa (excluding high income)Middle East & North Africa (IDA & IBRD countries)Middle incomeMoldovaMongoliaMontenegroMoroccoMozambiqueMyanmarNamibiaNauruNepalNew CaledoniaNicaraguaNigerNigeriaNorth AmericaOECD membersOmanOther small statesPacific island small statesPakistanPalauPanamaPapua New GuineaParaguayPeruPhilippinesQatarRwandaSamoaSao Tome and PrincipeSaudi ArabiaSenegalSerbiaSeychellesSierra LeoneSingaporeSloveniaSmall statesSolomon IslandsSomaliaSouth AfricaSouth AsiaSouth Asia (IDA & IBRD)South SudanSri LankaSt. Kitts and NevisSt. LuciaSt. Vincent and the GrenadinesSub-Saharan Africa Sub-Saharan Africa (excluding high income)Sub-Saharan Africa (IDA & IBRD countries)SudanSurinameSwazilandSyrian Arab RepublicTajikistanTanzaniaThailandTimor-LesteTogoTongaTrinidad and TobagoTunisiaTurkeyTurkmenistanTuvaluUgandaUkraineUpper middle incomeUruguayUzbekistanVanuatuVenezuela, RBVietnamWest Bank and GazaWorldYemen, Rep.ZambiaZimbabwe

Linha do tempo:

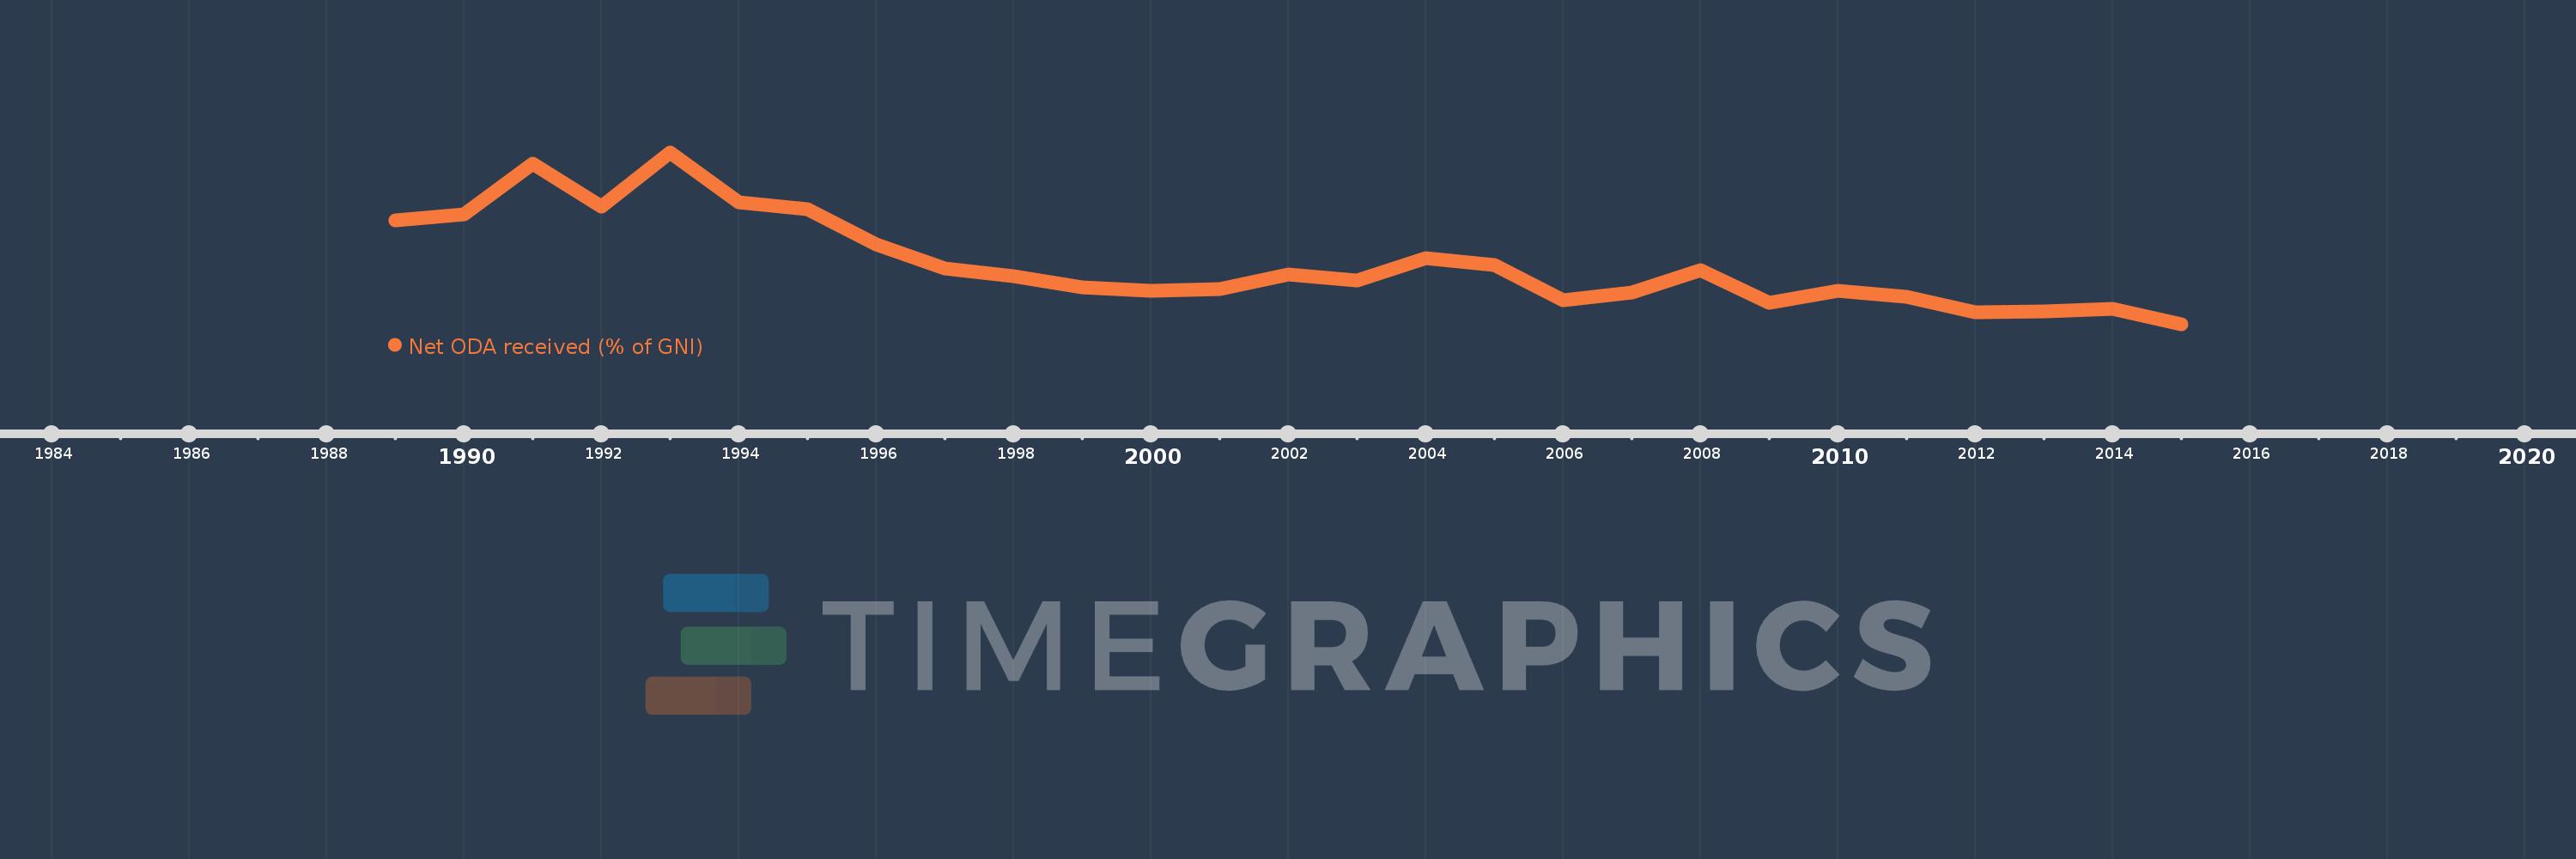
Nesta escala de tempo está apresentado um gráfico de 1989 ano até 2015 ano Tanzania. Dados de 1988 ano ausente. O número de observações reais por data: 27.

Fonte (nome):

Indicadores de desenvolvimento mundial

Fonte (organização):

Development Assistance Committee of the Organisation for Economic Co-operation and Development, Geographical Distribution of Financial Flows to Developing Countries, Development Co-operation Report, and International Development Statistics database. Data are available online at: www.oecd.org/dac/stats/idsonline. World Bank GNI estimates are used for the denominator.

Categorias:

Aid Effectiveness, Economy & Growth, External Debt

Foi atualizado:

23 abr 2017 ano

Indicadores de alterações dos valores ao longo dos anos

Em média:
14.282
Mínimo:
5.554
1 jan 2015 ano
Máximo:
30.222
1 jan 1993 ano
Na data de observação
Valor
Mudança absoluta
A alteração em relação ao valor anterior
1 jan 1989 ano
20.486
+20.486
0.0%
1 jan 1990 ano
21.384
+0.898
4.38%
1 jan 1991 ano
28.563
+7.179
33.57%
1 jan 1992 ano
22.489
-6.073
-21.26%
1 jan 1993 ano
30.222
+7.732
34.38%
1 jan 1994 ano
23.071
-7.151
-23.66%
1 jan 1995 ano
22.115
-0.956
-4.14%
1 jan 1996 ano
16.994
-5.122
-23.16%
1 jan 1997 ano
13.499
-3.495
-20.56%
1 jan 1998 ano
12.481
-1.018
-7.54%
1 jan 1999 ano
10.838
-1.643
-13.17%
1 jan 2000 ano
10.329
-0.509
-4.7%
1 jan 2001 ano
10.58
+0.251
2.43%
1 jan 2002 ano
12.663
+2.083
19.68%
1 jan 2003 ano
11.859
-0.804
-6.35%
1 jan 2004 ano
15.05
+3.191
26.91%
1 jan 2005 ano
14.071
-0.978
-6.5%
1 jan 2006 ano
9.044
-5.027
-35.73%
1 jan 2007 ano
10.132
+1.088
12.03%
1 jan 2008 ano
13.297
+3.165
31.24%
1 jan 2009 ano
8.618
-4.679
-35.19%
1 jan 2010 ano
10.373
+1.756
20.37%
1 jan 2011 ano
9.513
-0.86
-8.29%
1 jan 2012 ano
7.258
-2.255
-23.7%
1 jan 2013 ano
7.332
+0.074
1.01%
1 jan 2014 ano
7.811
+0.48
6.54%
1 jan 2015 ano
5.554
-2.258
-28.9%

Classificação de países por estatísticas atuais por anos