29
/pt/
pt
AIzaSyAYiBZKx7MnpbEhh9jyipgxe19OcubqV5w
April 1, 2024
74247
Austria
AUT
true
2
1
Other expense (% of expense)
2015,2014,2013,2012,2011,2010,2009,2008,2007,2006,2005,2004,2003,2002,2001,2000,1999,1998,1997,1996,1995,1994,1993,1992,1991
Download
Biblioteca de estatísticas globais →Austria →

Other expense (% of expense)

Estas estatísticas em outros países:
AfghanistanAlbaniaAlgeriaAngolaArab WorldArmeniaAustraliaAustriaAzerbaijanBahrainBangladeshBarbadosBelarusBelgiumBelizeBeninBhutanBoliviaBosnia and HerzegovinaBotswanaBrazilBulgariaBurkina FasoBurundiCabo VerdeCambodiaCanadaCaribbean small statesCentral African RepublicCentral Europe and the BalticsChileColombiaCongo, Dem. Rep.Congo, Rep.Costa RicaCote d'IvoireCroatiaCyprusCzech RepublicDenmarkDominican RepublicEarly-demographic dividendEast Asia & PacificEast Asia & Pacific (excluding high income)East Asia & Pacific (IDA & IBRD countries)Egypt, Arab Rep.El SalvadorEquatorial GuineaEstoniaEthiopiaEuro areaEurope & Central AsiaEurope & Central Asia (excluding high income)Europe & Central Asia (IDA & IBRD countries)European UnionFijiFinlandFranceGambia, TheGeorgiaGermanyGhanaGreeceGrenadaGuatemalaHeavily indebted poor countries (HIPC)High incomeHondurasHong Kong SAR, ChinaHungaryIBRD onlyIcelandIDA & IBRD totalIDA onlyIDA totalIndiaIndonesiaIran, Islamic Rep.IraqIrelandIsraelItalyJamaicaJapanJordanKazakhstanKenyaKiribatiKorea, Rep.KuwaitKyrgyz RepublicLao PDRLate-demographic dividendLatin America & Caribbean Latin America & Caribbean (excluding high income)Latin America & the Caribbean (IDA & IBRD countries)LatviaLeast developed countries: UN classificationLebanonLesothoLithuaniaLow & middle incomeLow incomeLower middle incomeLuxembourgMacao SAR, ChinaMacedonia, FYRMadagascarMalawiMalaysiaMaldivesMaliMaltaMauritiusMicronesia, Fed. Sts.Middle East & North AfricaMiddle East & North Africa (excluding high income)Middle East & North Africa (IDA & IBRD countries)Middle incomeMoldovaMongoliaMoroccoMozambiqueNamibiaNepalNetherlandsNew ZealandNicaraguaNorth AmericaNorwayOECD membersOmanOther small statesPakistanPanamaPapua New GuineaParaguayPeruPhilippinesPolandPortugalPost-demographic dividendPre-demographic dividendQatarRomaniaRussian FederationRwandaSamoaSan MarinoSao Tome and PrincipeSerbiaSeychellesSierra LeoneSlovak RepublicSloveniaSmall statesSolomon IslandsSouth AfricaSouth AsiaSouth Asia (IDA & IBRD)SpainSri LankaSub-Saharan Africa Sub-Saharan Africa (excluding high income)Sub-Saharan Africa (IDA & IBRD countries)SurinameSwazilandSwedenSwitzerlandTajikistanTanzaniaThailandTimor-LesteTogoTrinidad and TobagoTunisiaTurkeyUgandaUkraineUnited Arab EmiratesUnited KingdomUnited StatesUpper middle incomeUruguayVanuatuVenezuela, RBWest Bank and GazaWorldYemen, Rep.Zambia
Linha do tempo:
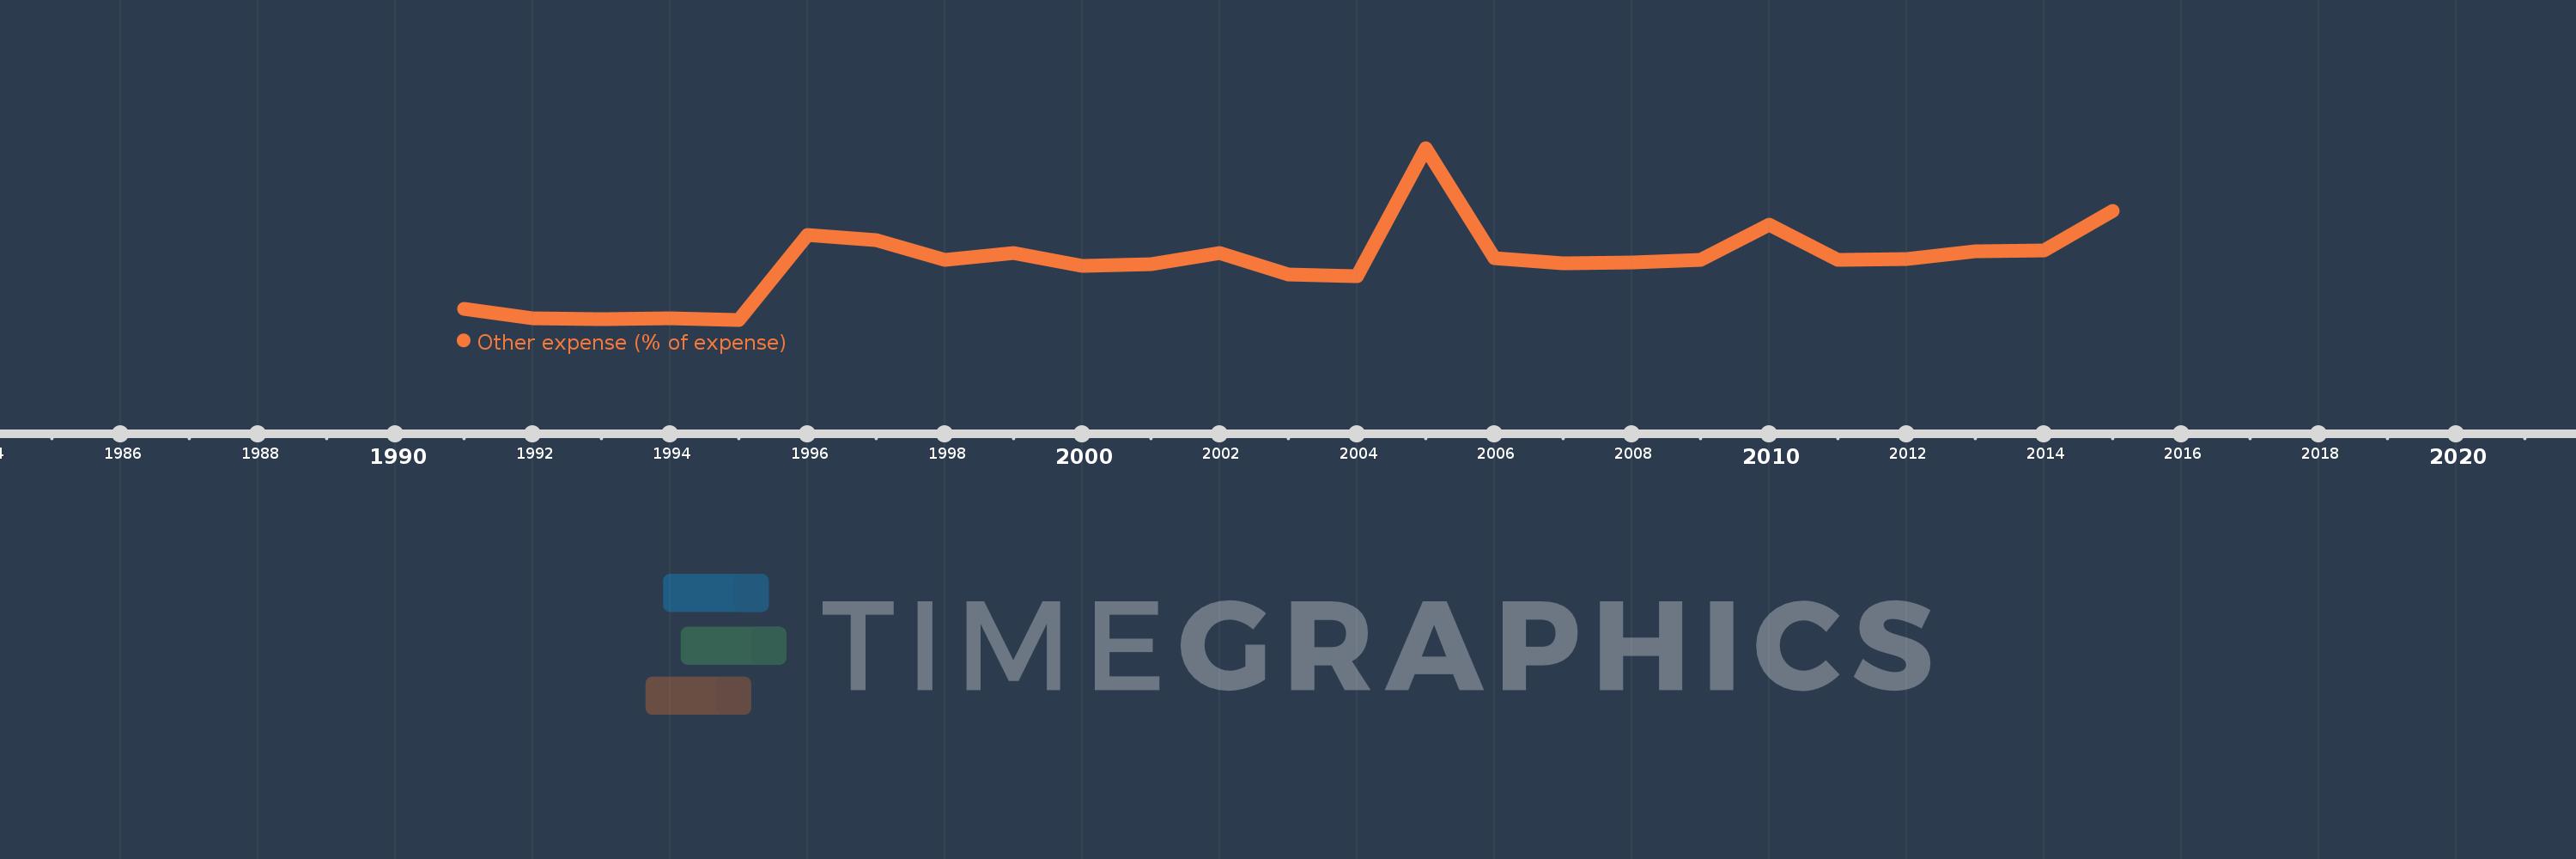
Nesta escala de tempo está apresentado um gráfico de 1991 ano até 2015 ano Austria. Dados de 1990 ano ausente. O número de observações reais por data: 25.
Fonte (nome):
Indicadores de desenvolvimento mundial
Fonte (organização):
International Monetary Fund, Government Finance Statistics Yearbook and data files.
Categorias:
Public Sector
Foi atualizado:
23 abr 2017 ano
Indicadores de alterações dos valores ao longo dos anos
Em média:
5.395
Mínimo:
2.065
1 jan 1995 ano
Máximo:
11.989
1 jan 2005 ano
Na data de observação
Valor
Mudança absoluta
A alteração em relação ao valor anterior
1 jan 1991 ano
2.678
+2.678
0.0%
1 jan 1992 ano
2.145
-0.533
-19.89%
1 jan 1993 ano
2.078
-0.067
-3.12%
1 jan 1994 ano
2.144
+0.066
3.16%
1 jan 1995 ano
2.065
-0.079
-3.67%
1 jan 1996 ano
6.986
+4.921
238.25%
1 jan 1997 ano
6.644
-0.342
-4.9%
1 jan 1998 ano
5.546
-1.097
-16.51%
1 jan 1999 ano
5.929
+0.382
6.9%
1 jan 2000 ano
5.164
-0.764
-12.89%
1 jan 2001 ano
5.296
+0.132
2.55%
1 jan 2002 ano
5.934
+0.638
12.05%
1 jan 2003 ano
4.695
-1.239
-20.88%
1 jan 2004 ano
4.603
-0.092
-1.95%
1 jan 2005 ano
11.989
+7.386
160.44%
1 jan 2006 ano
5.633
-6.356
-53.01%
1 jan 2007 ano
5.339
-0.295
-5.23%
1 jan 2008 ano
5.375
+0.037
0.69%
1 jan 2009 ano
5.5
+0.124
2.31%
1 jan 2010 ano
7.582
+2.082
37.86%
1 jan 2011 ano
5.505
-2.077
-27.39%
1 jan 2012 ano
5.595
+0.09
1.64%
1 jan 2013 ano
5.996
+0.401
7.16%
1 jan 2014 ano
6.074
+0.078
1.31%
1 jan 2015 ano
8.368
+2.294
37.76%
Classificação de países por estatísticas atuais por anos

Comentários:

Enviar
PremiumAbout & FeedbackAcordoPrivacidade
logo
© 2022 Selected Technologies LLC – Morgan Hill, California