33
/pt/
AIzaSyAYiBZKx7MnpbEhh9jyipgxe19OcubqV5w
August 1, 2025
153873
Iceland
ISL
true
2
1
Other expense (% of expense)
2016,2015,2014,2013,2012,2011,2010,2009,2008,2007,2006,2005,2004,2003,2002,2001,2000,1999,1998,1997,1996,1995,1994,1993,1992,1991
Download
Biblioteca de estatísticas globais →Iceland →

Other expense (% of expense)

Estas estatísticas em outros países:

AfghanistanAlbaniaAlgeriaAngolaArab WorldArmeniaAustraliaAustriaAzerbaijanBahrainBangladeshBarbadosBelarusBelgiumBelizeBeninBhutanBoliviaBosnia and HerzegovinaBotswanaBrazilBulgariaBurkina FasoBurundiCabo VerdeCambodiaCanadaCaribbean small statesCentral African RepublicCentral Europe and the BalticsChileColombiaCongo, Dem. Rep.Congo, Rep.Costa RicaCote d'IvoireCroatiaCyprusCzech RepublicDenmarkDominican RepublicEarly-demographic dividendEast Asia & PacificEast Asia & Pacific (excluding high income)East Asia & Pacific (IDA & IBRD countries)Egypt, Arab Rep.El SalvadorEquatorial GuineaEstoniaEthiopiaEuro areaEurope & Central AsiaEurope & Central Asia (excluding high income)Europe & Central Asia (IDA & IBRD countries)European UnionFijiFinlandFranceGambia, TheGeorgiaGermanyGhanaGreeceGrenadaGuatemalaHeavily indebted poor countries (HIPC)High incomeHondurasHong Kong SAR, ChinaHungaryIBRD onlyIcelandIDA & IBRD totalIDA onlyIDA totalIndiaIndonesiaIran, Islamic Rep.IraqIrelandIsraelItalyJamaicaJapanJordanKazakhstanKenyaKiribatiKorea, Rep.KuwaitKyrgyz RepublicLao PDRLate-demographic dividendLatin America & Caribbean Latin America & Caribbean (excluding high income)Latin America & the Caribbean (IDA & IBRD countries)LatviaLeast developed countries: UN classificationLebanonLesothoLithuaniaLow & middle incomeLow incomeLower middle incomeLuxembourgMacao SAR, ChinaMacedonia, FYRMadagascarMalawiMalaysiaMaldivesMaliMaltaMauritiusMicronesia, Fed. Sts.Middle East & North AfricaMiddle East & North Africa (excluding high income)Middle East & North Africa (IDA & IBRD countries)Middle incomeMoldovaMongoliaMoroccoMozambiqueNamibiaNepalNetherlandsNew ZealandNicaraguaNorth AmericaNorwayOECD membersOmanOther small statesPakistanPanamaPapua New GuineaParaguayPeruPhilippinesPolandPortugalPost-demographic dividendPre-demographic dividendQatarRomaniaRussian FederationRwandaSamoaSan MarinoSao Tome and PrincipeSerbiaSeychellesSierra LeoneSlovak RepublicSloveniaSmall statesSolomon IslandsSouth AfricaSouth AsiaSouth Asia (IDA & IBRD)SpainSri LankaSub-Saharan Africa Sub-Saharan Africa (excluding high income)Sub-Saharan Africa (IDA & IBRD countries)SurinameSwazilandSwedenSwitzerlandTajikistanTanzaniaThailandTimor-LesteTogoTrinidad and TobagoTunisiaTurkeyUgandaUkraineUnited Arab EmiratesUnited KingdomUnited StatesUpper middle incomeUruguayVanuatuVenezuela, RBWest Bank and GazaWorldYemen, Rep.Zambia

Linha do tempo:

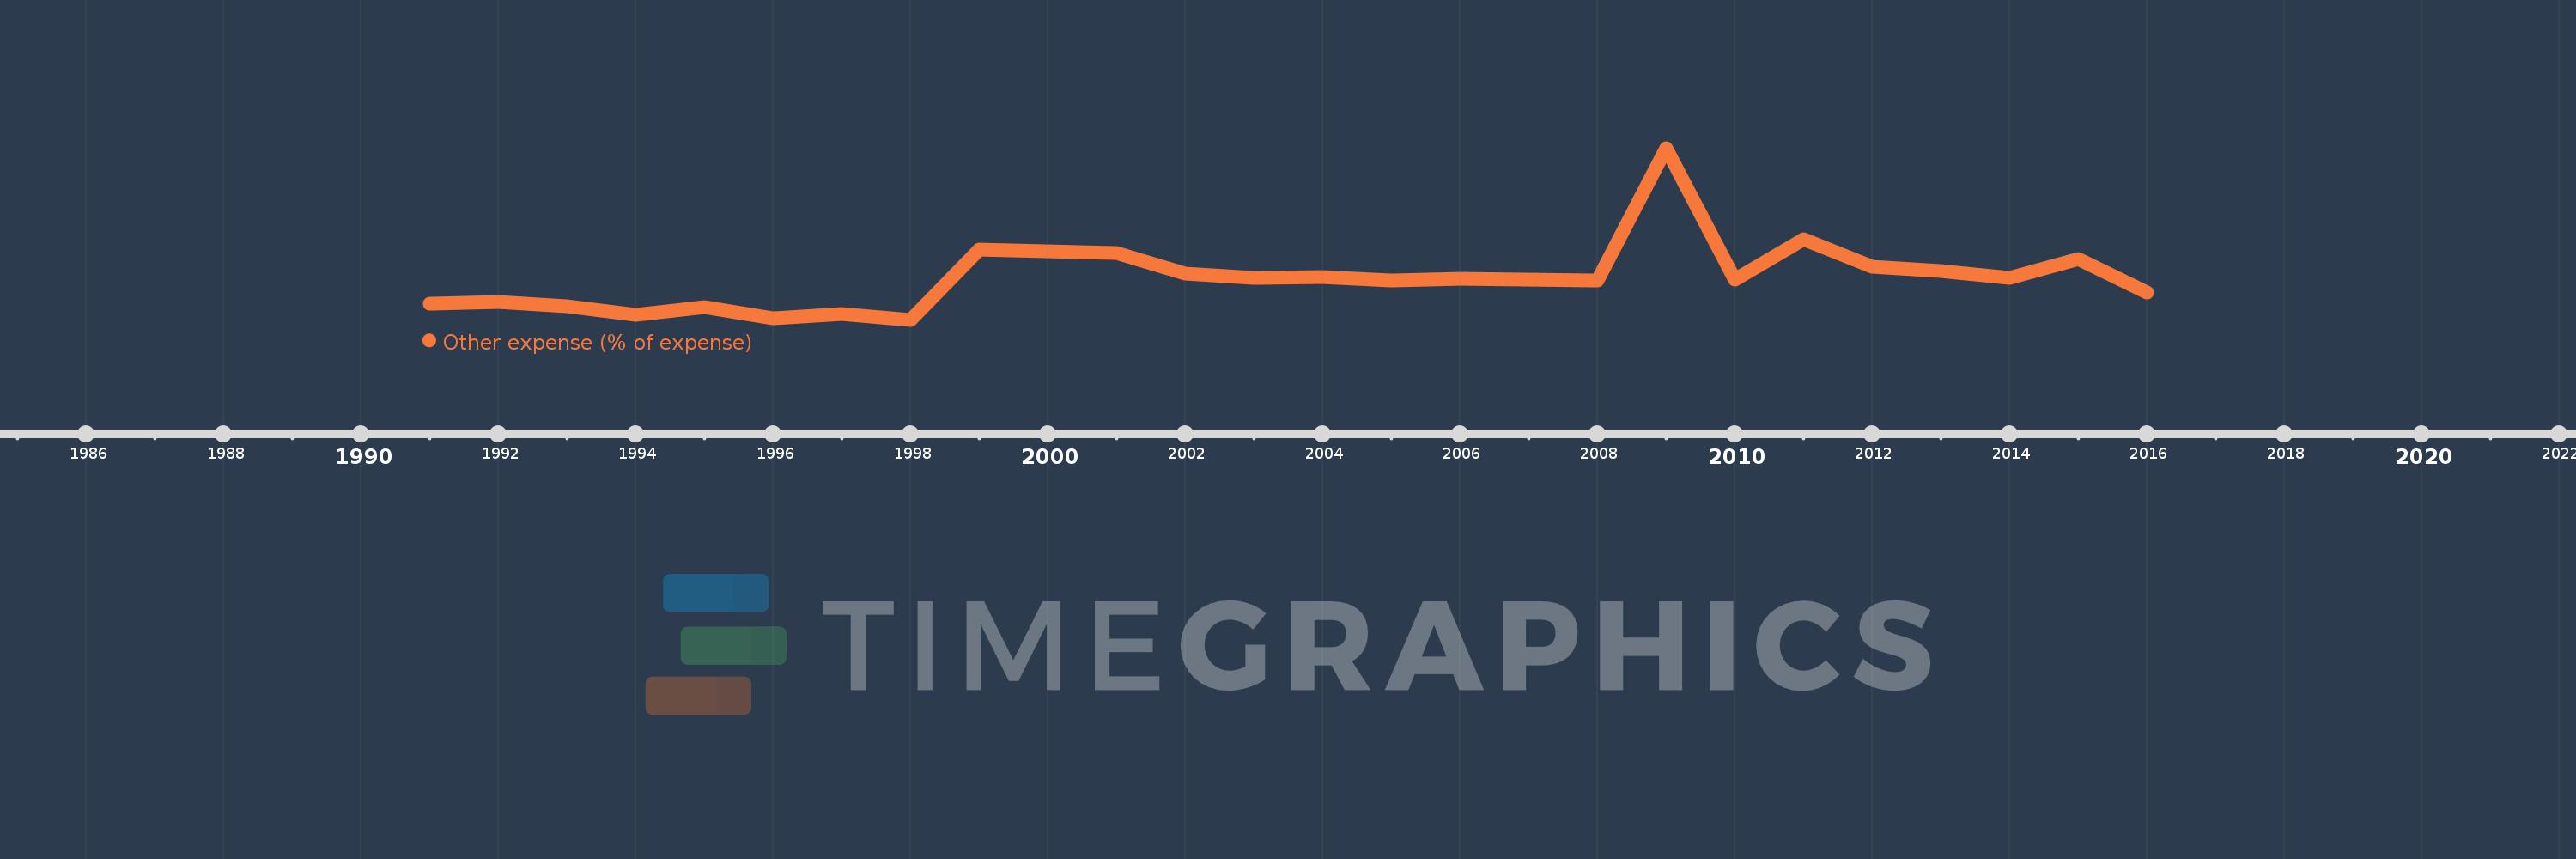
Nesta escala de tempo está apresentado um gráfico de 1991 ano até 2016 ano Iceland. Dados de 1990 ano ausente. O número de observações reais por data: 26.

Fonte (nome):

Indicadores de desenvolvimento mundial

Fonte (organização):

International Monetary Fund, Government Finance Statistics Yearbook and data files.

Categorias:

Public Sector

Foi atualizado:

23 abr 2017 ano

Indicadores de alterações dos valores ao longo dos anos

Em média:
10.199
Mínimo:
1.655
1 jan 1998 ano
Máximo:
36.612
1 jan 2009 ano
Na data de observação
Valor
Mudança absoluta
A alteração em relação ao valor anterior
1 jan 1991 ano
4.888
+4.888
0.0%
1 jan 1992 ano
5.353
+0.465
9.51%
1 jan 1993 ano
4.369
-0.984
-18.38%
1 jan 1994 ano
2.63
-1.738
-39.79%
1 jan 1995 ano
4.163
+1.532
58.26%
1 jan 1996 ano
1.977
-2.185
-52.49%
1 jan 1997 ano
2.844
+0.867
43.84%
1 jan 1998 ano
1.655
-1.19
-41.83%
1 jan 1999 ano
16.007
+14.353
867.48%
1 jan 2000 ano
15.624
-0.383
-2.4%
1 jan 2001 ano
15.217
-0.407
-2.6%
1 jan 2002 ano
10.956
-4.261
-28.0%
1 jan 2003 ano
10.251
-0.705
-6.43%
1 jan 2004 ano
10.255
+0.004
0.04%
1 jan 2005 ano
9.701
-0.554
-5.4%
1 jan 2006 ano
10.022
+0.321
3.31%
1 jan 2007 ano
9.747
-0.275
-2.74%
1 jan 2008 ano
9.68
-0.067
-0.69%
1 jan 2009 ano
36.612
+26.932
278.21%
1 jan 2010 ano
9.83
-26.782
-73.15%
1 jan 2011 ano
18.114
+8.284
84.27%
1 jan 2012 ano
12.382
-5.732
-31.64%
1 jan 2013 ano
11.606
-0.777
-6.27%
1 jan 2014 ano
10.088
-1.518
-13.08%
1 jan 2015 ano
13.942
+3.854
38.21%
1 jan 2016 ano
7.25
-6.692
-48.0%

Classificação de países por estatísticas atuais por anos