33
/pt/
AIzaSyB4mHJ5NPEv-XzF7P6NDYXjlkCWaeKw5bc
November 1, 2025
54806
Post-demographic dividend
PST
false
2
1
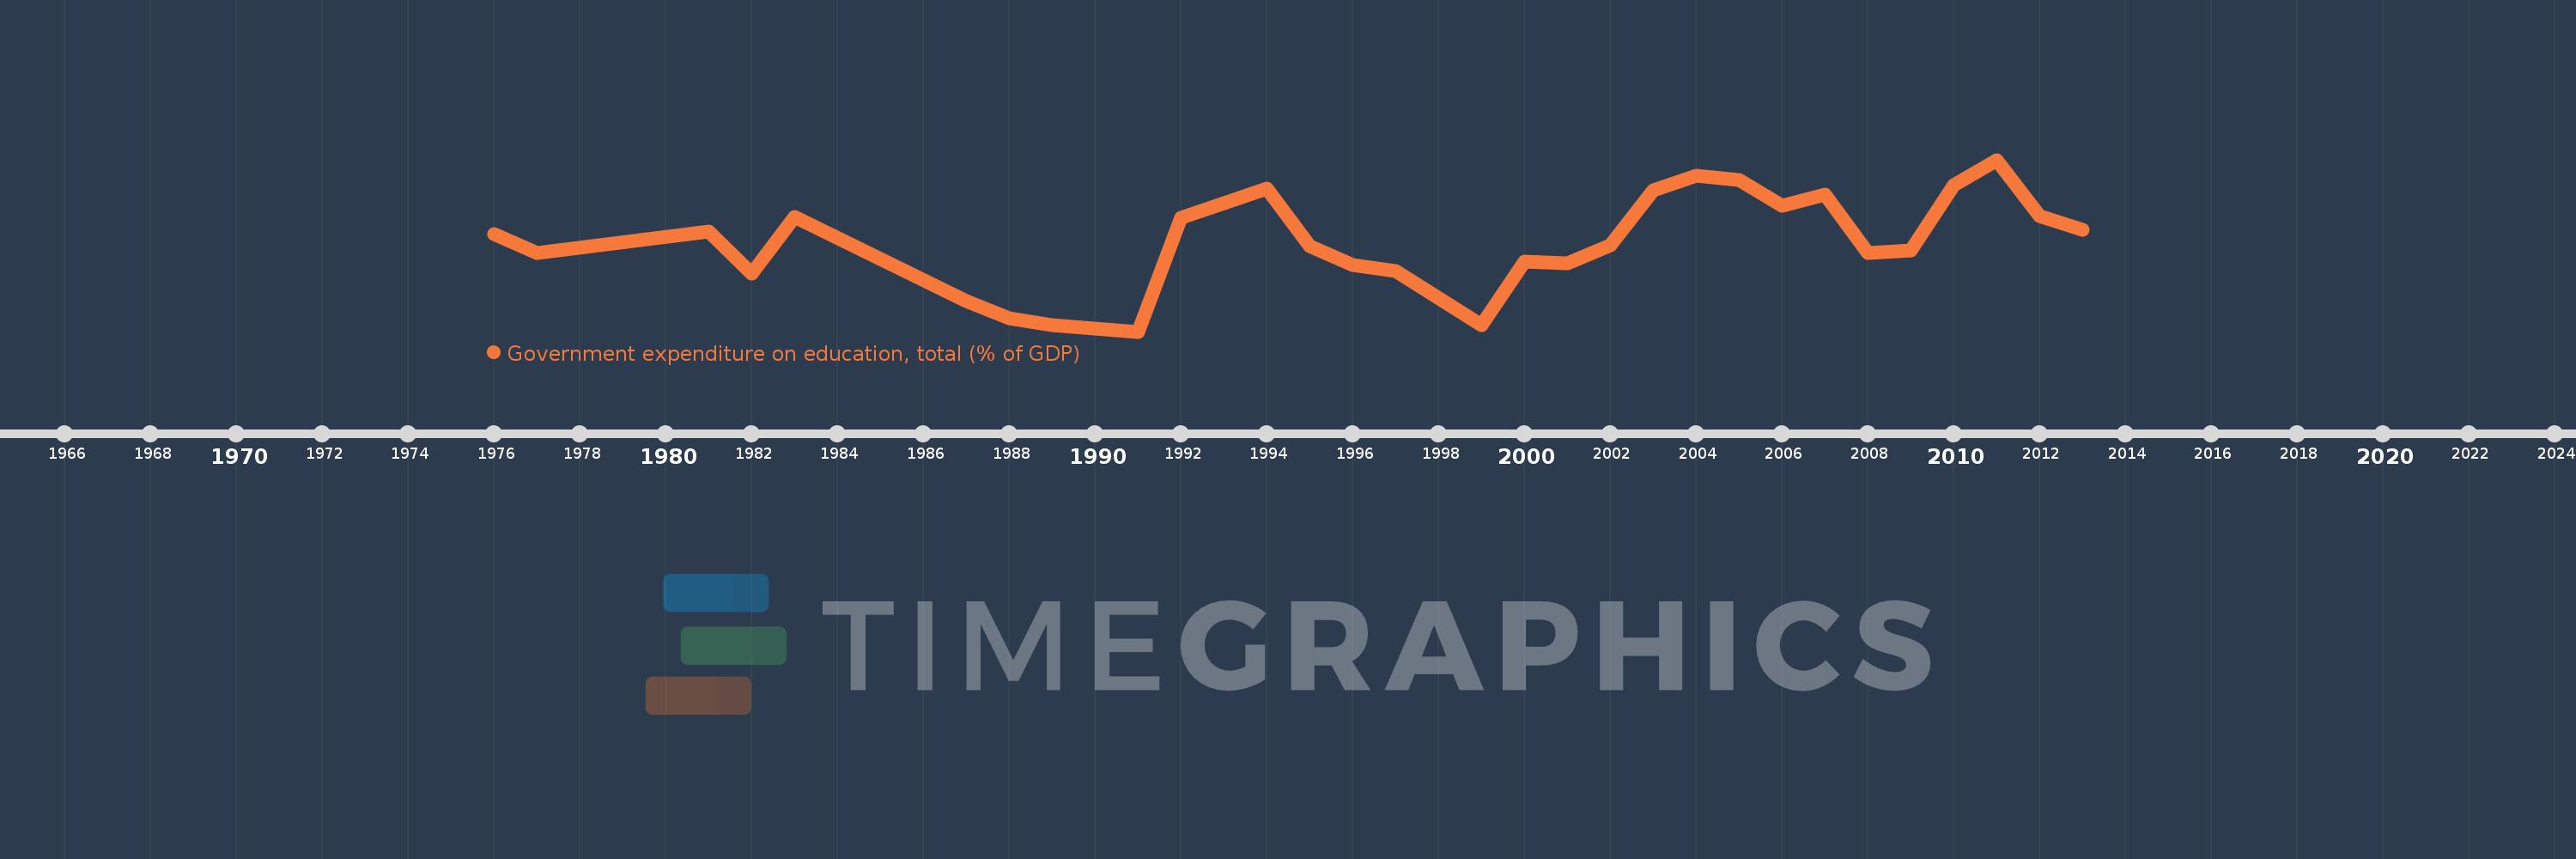
Government expenditure on education, total (% of GDP)
2013,2012,2011,2010,2009,2008,2007,2006,2005,2004,2003,2002,2001,2000,1999,1997,1996,1995,1994,1992,1991,1989,1988,1987,1983,1982,1981,1977,1976