33
/pt/
AIzaSyB4mHJ5NPEv-XzF7P6NDYXjlkCWaeKw5bc
November 1, 2025
163793
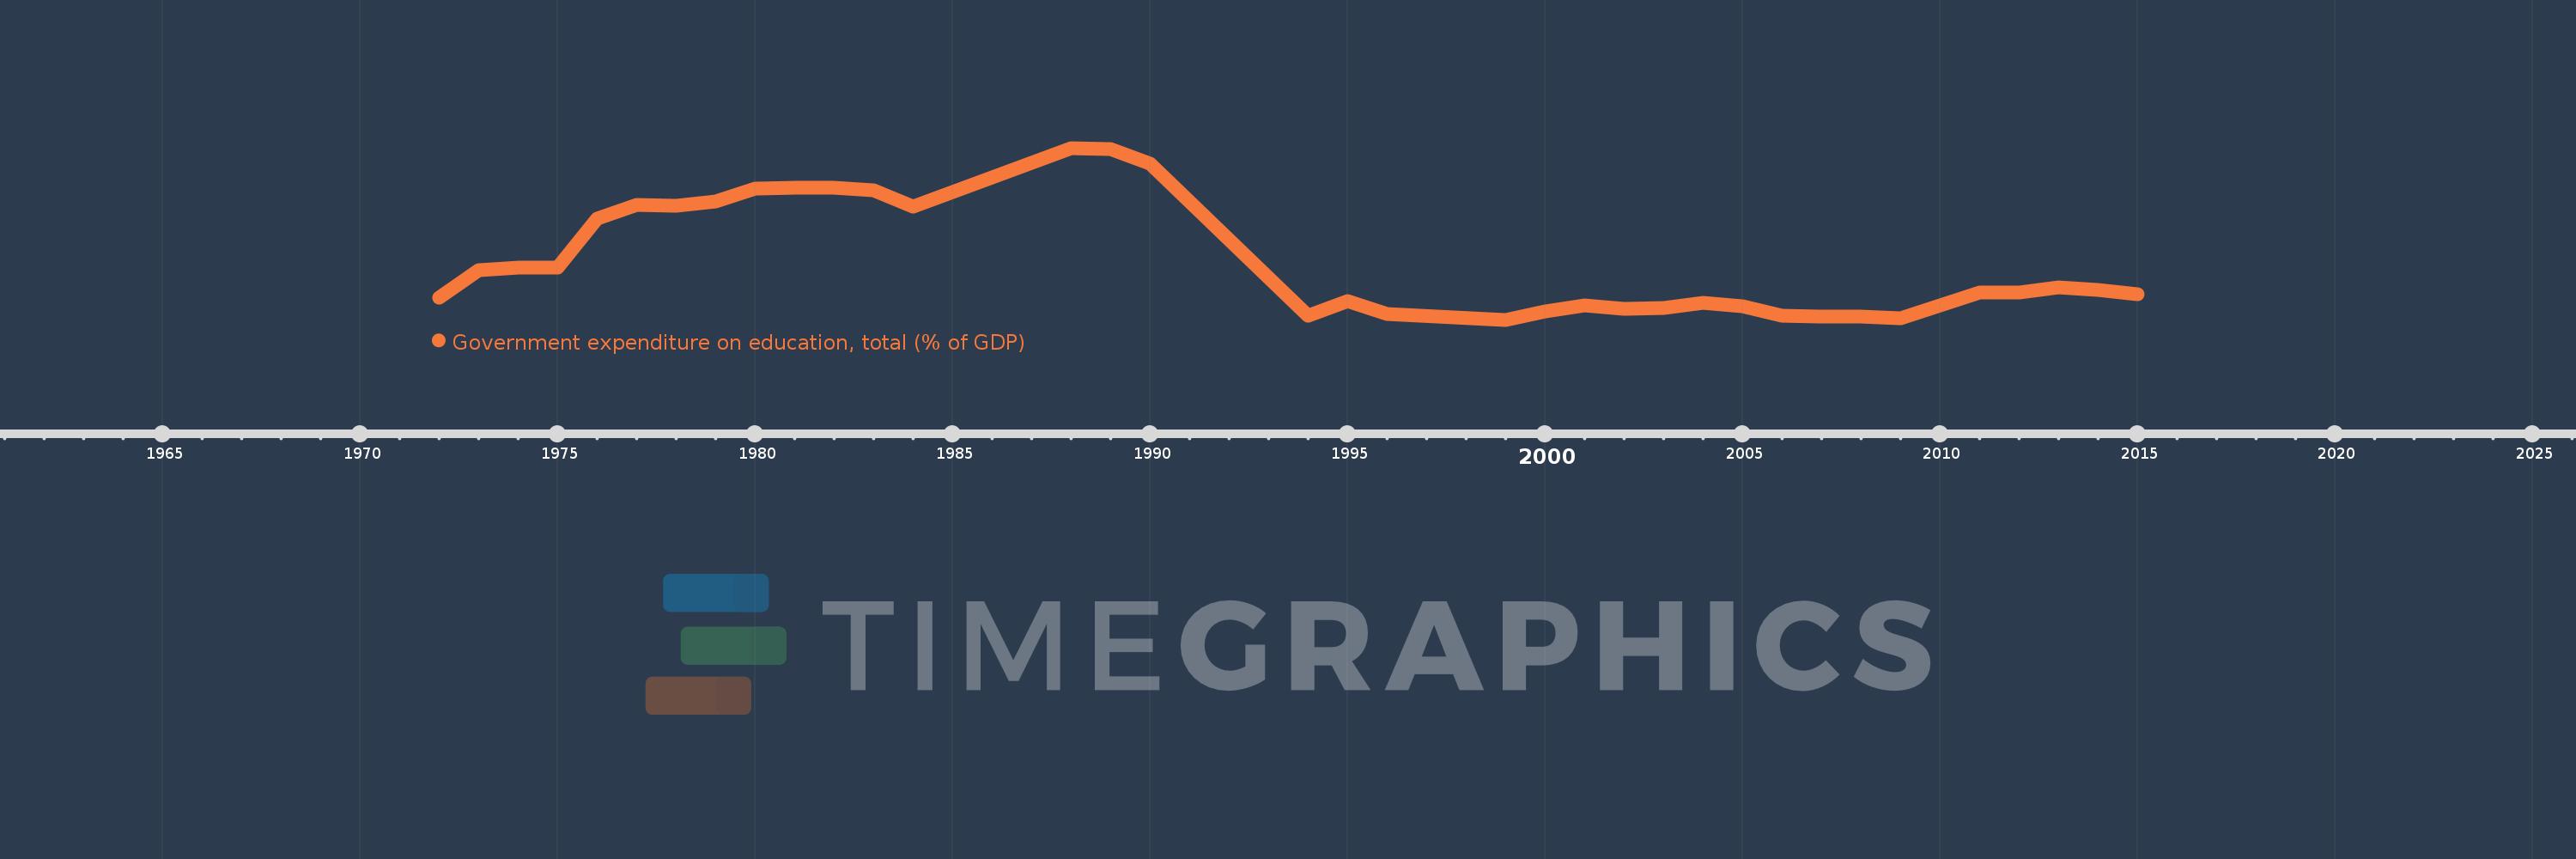
Japan
JPN
true
2
1
Government expenditure on education, total (% of GDP)
2015,2014,2013,2012,2011,2009,2008,2007,2006,2005,2004,2003,2002,2001,2000,1999,1996,1995,1994,1990,1989,1988,1984,1983,1982,1981,1980,1979,1978,1977,1976,1975,1974,1973,1972