29
/pt/
pt
AIzaSyAYiBZKx7MnpbEhh9jyipgxe19OcubqV5w
April 1, 2024
53711
Other small states
OSS
false
2
1
Percentage of teachers in secondary education who are trained, both sexes (%)
2015,2014,2013,2012,2009,2008,2007,2006,2005
Download
Biblioteca de estatísticas globais →Other small states →

Percentage of teachers in secondary education who are trained, both sexes (%)

Estas estatísticas em outros países:
AndorraAntigua and BarbudaArab WorldArubaBahamas, TheBahrainBangladeshBarbadosBelarusBelizeBeninBermudaBhutanBotswanaBritish Virgin IslandsBrunei DarussalamBurkina FasoBurundiCabo VerdeCambodiaCameroonCaribbean small statesCayman IslandsChadColombiaComorosCongo, Dem. Rep.Congo, Rep.Costa RicaCote d'IvoireCroatiaCubaDjiboutiDominicaDominican RepublicEcuadorEgypt, Arab Rep.El SalvadorEquatorial GuineaEritreaEthiopiaFijiFragile and conflict affected situationsGambia, TheGeorgiaGhanaGibraltarGrenadaGuineaGuyanaHeavily indebted poor countries (HIPC)HondurasHong Kong SAR, ChinaIDA blendIDA onlyIDA totalIran, Islamic Rep.IraqJamaicaKazakhstanKenyaKiribatiKuwaitKyrgyz RepublicLao PDRLatin America & Caribbean Latin America & Caribbean (excluding high income)Latin America & the Caribbean (IDA & IBRD countries)Least developed countries: UN classificationLebanonLesothoLiberiaLow incomeMacao SAR, ChinaMadagascarMalawiMalaysiaMaldivesMaliMauritaniaMauritiusMexicoMiddle East & North AfricaMiddle East & North Africa (excluding high income)Middle East & North Africa (IDA & IBRD countries)MongoliaMozambiqueMyanmarNamibiaNauruNepalNicaraguaNigerNigeriaOmanOther small statesPacific island small statesPanamaPapua New GuineaParaguayPeruPhilippinesPre-demographic dividendQatarRwandaSao Tome and PrincipeSaudi ArabiaSerbiaSeychellesSierra LeoneSingaporeSmall statesSolomon IslandsSri LankaSt. Kitts and NevisSt. LuciaSt. Vincent and the GrenadinesSub-Saharan Africa Sub-Saharan Africa (excluding high income)Sub-Saharan Africa (IDA & IBRD countries)SudanSurinameSwazilandSyrian Arab RepublicTajikistanTogoTongaTurks and Caicos IslandsUgandaUnited Arab EmiratesUzbekistanWest Bank and GazaZimbabwe
Linha do tempo:
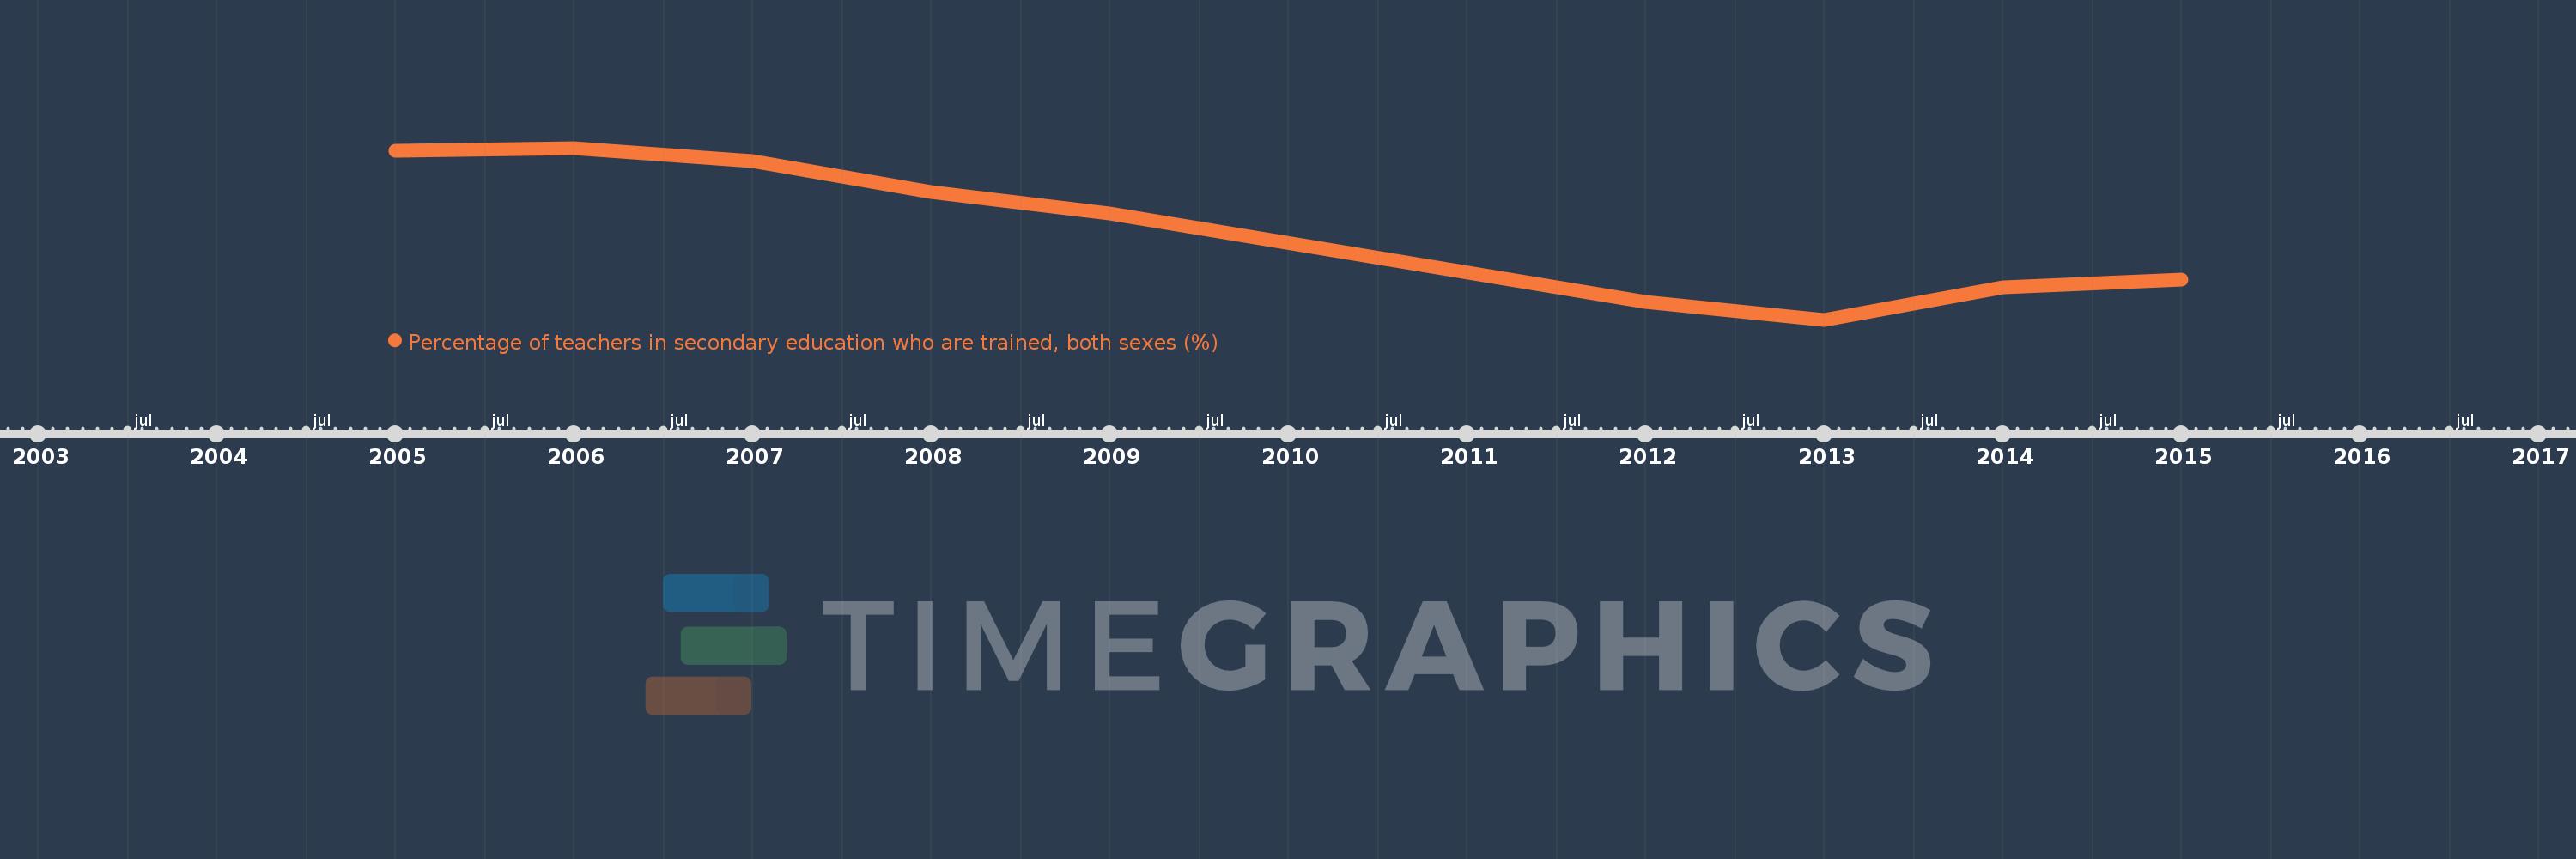
Nesta escala de tempo está apresentado um gráfico de 2005 ano até 2015 ano Other small states. Dados de 2004 ano ausente. O número de observações reais por data: 9.
Fonte (nome):
Indicadores de desenvolvimento mundial
Fonte (organização):
UNESCO Institute for Statistics
Categorias:
Education
Foi atualizado:
23 abr 2017 ano
Indicadores de alterações dos valores ao longo dos anos
Em média:
79.653
Mínimo:
71.672
1 jan 2013 ano
Máximo:
86.641
1 jan 2006 ano
Na data de observação
Valor
Mudança absoluta
A alteração em relação ao valor anterior
1 jan 2005 ano
86.363
+86.363
0.0%
1 jan 2006 ano
86.641
+0.278
0.32%
1 jan 2007 ano
85.522
-1.119
-1.29%
1 jan 2008 ano
82.83
-2.692
-3.15%
1 jan 2009 ano
80.944
-1.886
-2.28%
1 jan 2012 ano
73.247
-7.697
-9.51%
1 jan 2013 ano
71.672
-1.575
-2.15%
1 jan 2014 ano
74.458
+2.786
3.89%
1 jan 2015 ano
75.199
+0.742
1.0%
Classificação de países por estatísticas atuais por anos

Comentários:

Enviar
PremiumAbout & FeedbackAcordoPrivacidade
logo
© 2022 Selected Technologies LLC – Morgan Hill, California