29
/pt/
pt
AIzaSyAYiBZKx7MnpbEhh9jyipgxe19OcubqV5w
April 1, 2024
41868
Latin America & Caribbean
LCN
false
2
1
Pupil-teacher ratio, lower secondary
2015,2014,2013,2012,2011,2010,2009,2008,2007,2006,2005,2004,2003,2002,2001,2000,1999,1998
Download
Biblioteca de estatísticas globais →Latin America & Caribbean  →

Pupil-teacher ratio, lower secondary

Estas estatísticas em outros países:
AfghanistanAlbaniaAlgeriaAndorraAngolaAntigua and BarbudaArab WorldArgentinaAustriaBahamas, TheBahrainBangladeshBelarusBelgiumBelizeBeninBermudaBhutanBoliviaBosnia and HerzegovinaBrazilBritish Virgin IslandsBrunei DarussalamBulgariaBurkina FasoBurundiCabo VerdeCambodiaCameroonCanadaCaribbean small statesCayman IslandsCentral Europe and the BalticsChadChileChinaColombiaComorosCongo, Rep.Costa RicaCote d'IvoireCroatiaCubaCyprusCzech RepublicDenmarkDjiboutiDominicaDominican RepublicEarly-demographic dividendEast Asia & PacificEast Asia & Pacific (excluding high income)East Asia & Pacific (IDA & IBRD countries)EcuadorEgypt, Arab Rep.El SalvadorEquatorial GuineaEritreaEstoniaEthiopiaEuro areaEurope & Central AsiaEurope & Central Asia (excluding high income)Europe & Central Asia (IDA & IBRD countries)European UnionFijiFinlandFragile and conflict affected situationsFranceGambia, TheGeorgiaGermanyGhanaGibraltarGreeceGrenadaGuatemalaGuineaGuinea-BissauGuyanaHeavily indebted poor countries (HIPC)High incomeHondurasHong Kong SAR, ChinaHungaryIBRD onlyIDA & IBRD totalIDA blendIDA onlyIDA totalIndiaIndonesiaIran, Islamic Rep.IraqIsraelItalyJamaicaJapanJordanKenyaKiribatiKorea, Rep.KuwaitLao PDRLate-demographic dividendLatin America & Caribbean Latin America & Caribbean (excluding high income)Latin America & the Caribbean (IDA & IBRD countries)LatviaLeast developed countries: UN classificationLebanonLiberiaLiechtensteinLithuaniaLow & middle incomeLow incomeLower middle incomeLuxembourgMacao SAR, ChinaMacedonia, FYRMadagascarMalaysiaMaldivesMaliMaltaMarshall IslandsMauritaniaMexicoMiddle East & North AfricaMiddle East & North Africa (excluding high income)Middle East & North Africa (IDA & IBRD countries)Middle incomeMoldovaMonacoMongoliaMoroccoMozambiqueMyanmarNamibiaNauruNepalNetherlandsNew ZealandNicaraguaNigerNigeriaNorth AmericaNorwayOECD membersOmanOther small statesPacific island small statesPakistanPalauPanamaParaguayPeruPhilippinesPolandPortugalPost-demographic dividendPre-demographic dividendPuerto RicoQatarRomaniaRwandaSamoaSan MarinoSao Tome and PrincipeSaudi ArabiaSenegalSerbiaSeychellesSierra LeoneSingaporeSlovak RepublicSloveniaSmall statesSolomon IslandsSomaliaSouth AsiaSouth Asia (IDA & IBRD)South SudanSpainSri LankaSt. Kitts and NevisSt. LuciaSt. Vincent and the GrenadinesSub-Saharan Africa Sub-Saharan Africa (excluding high income)Sub-Saharan Africa (IDA & IBRD countries)SurinameSwazilandSwedenSwitzerlandSyrian Arab RepublicTajikistanThailandTimor-LesteTogoTongaTrinidad and TobagoTunisiaTurkeyTurks and Caicos IslandsTuvaluUgandaUnited Arab EmiratesUnited KingdomUnited StatesUpper middle incomeUruguayVanuatuVietnamWest Bank and GazaWorldYemen, Rep.Zambia
Linha do tempo:
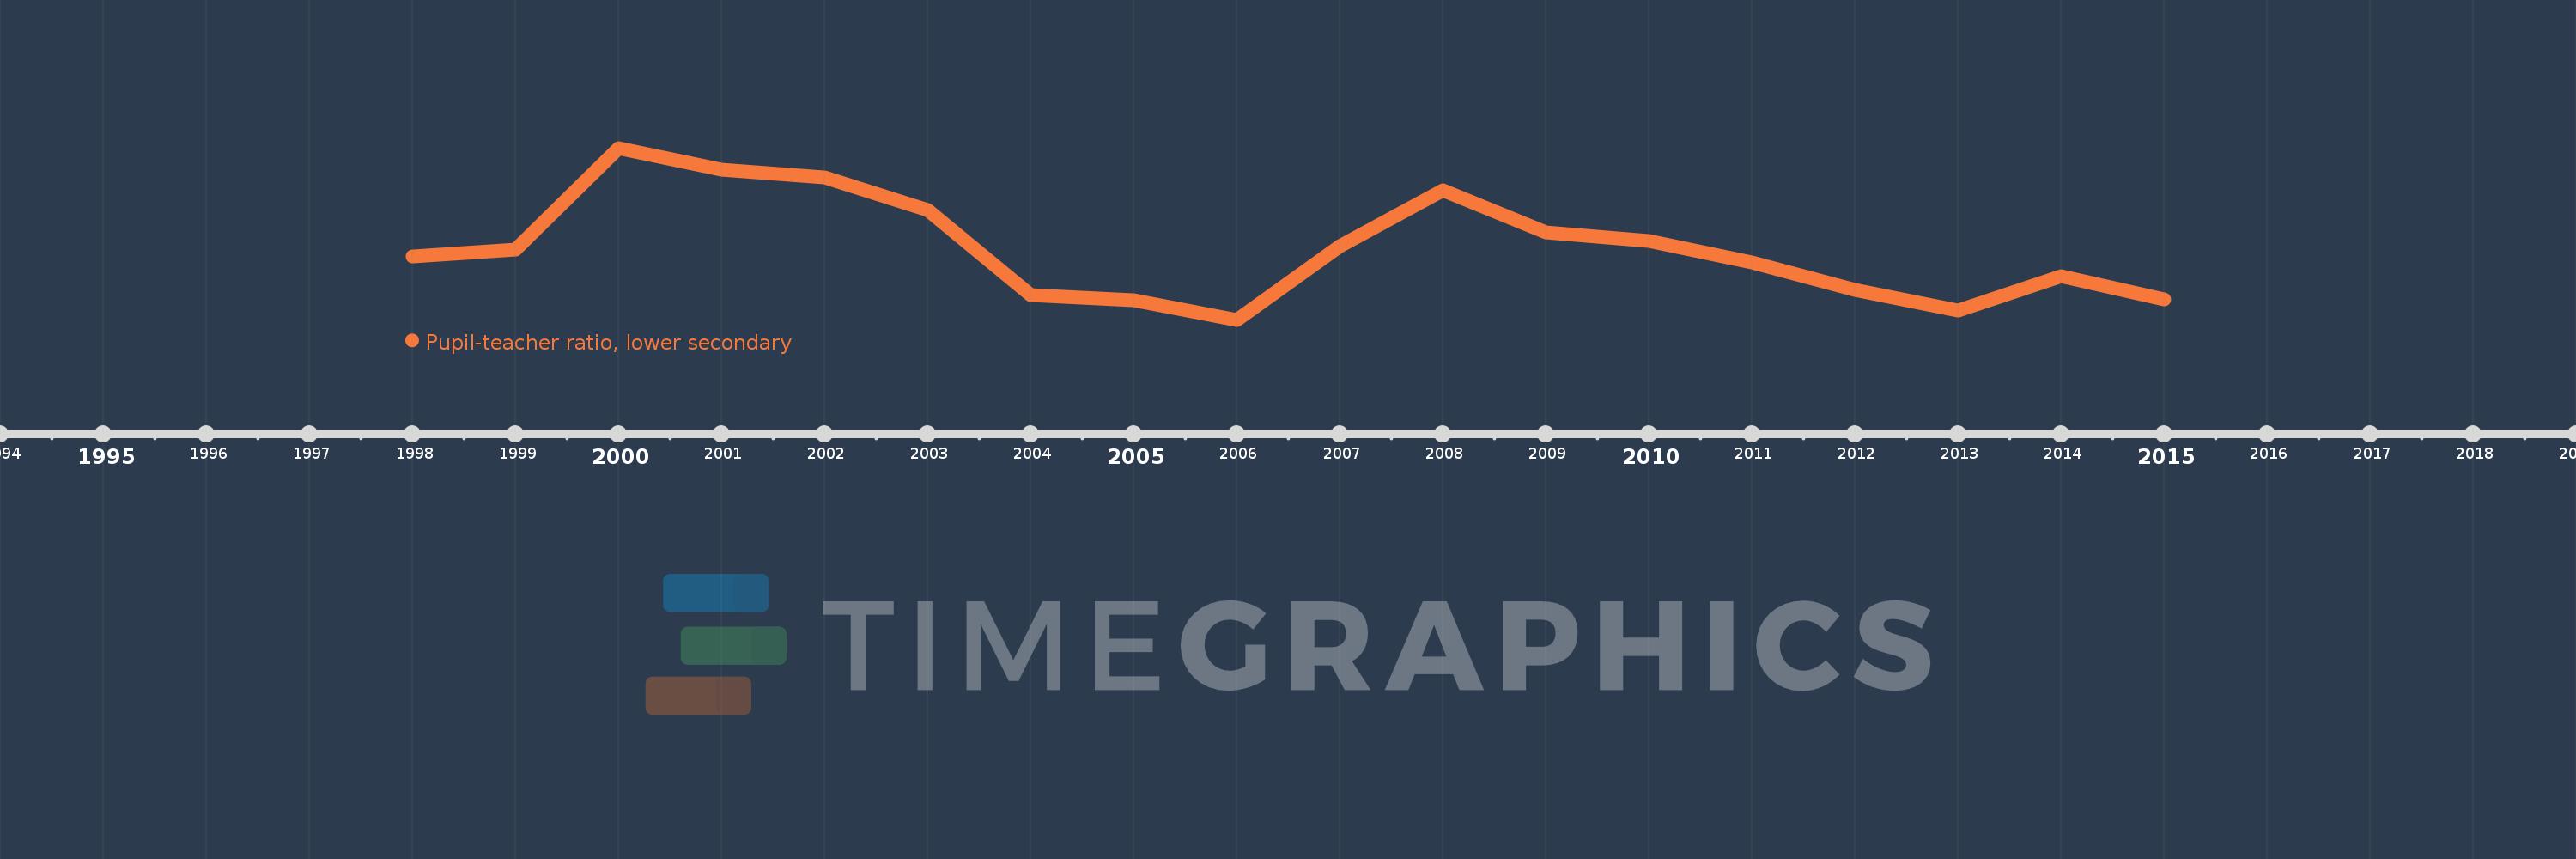
Nesta escala de tempo está apresentado um gráfico de 1998 ano até 2015 ano Latin America & Caribbean . Dados de 1997 ano ausente. O número de observações reais por data: 18.
Fonte (nome):
Indicadores de desenvolvimento mundial
Fonte (organização):
United Nations Educational, Scientific, and Cultural Organization (UNESCO) Institute for Statistics.
Categorias:
Education
Foi atualizado:
23 abr 2017 ano
Indicadores de alterações dos valores ao longo dos anos
Em média:
18.728
Mínimo:
17.79
1 jan 2006 ano
Máximo:
20.053
1 jan 2000 ano
Na data de observação
Valor
Mudança absoluta
A alteração em relação ao valor anterior
1 jan 1998 ano
18.626
+18.626
0.0%
1 jan 1999 ano
18.715
+0.09
0.48%
1 jan 2000 ano
20.053
+1.338
7.15%
1 jan 2001 ano
19.769
-0.284
-1.42%
1 jan 2002 ano
19.669
-0.1
-0.51%
1 jan 2003 ano
19.235
-0.434
-2.21%
1 jan 2004 ano
18.113
-1.122
-5.84%
1 jan 2005 ano
18.049
-0.064
-0.35%
1 jan 2006 ano
17.79
-0.259
-1.43%
1 jan 2007 ano
18.756
+0.967
5.43%
1 jan 2008 ano
19.5
+0.744
3.97%
1 jan 2009 ano
18.944
-0.556
-2.85%
1 jan 2010 ano
18.832
-0.112
-0.59%
1 jan 2011 ano
18.545
-0.287
-1.52%
1 jan 2012 ano
18.178
-0.367
-1.98%
1 jan 2013 ano
17.916
-0.263
-1.45%
1 jan 2014 ano
18.364
+0.448
2.5%
1 jan 2015 ano
18.053
-0.311
-1.69%
Classificação de países por estatísticas atuais por anos

Comentários:

Enviar
PremiumAbout & FeedbackAcordoPrivacidade
logo
© 2022 Selected Technologies LLC – Morgan Hill, California