30
/pt/
AIzaSyAYiBZKx7MnpbEhh9jyipgxe19OcubqV5w
April 1, 2024
40253
IDA total
IDA
false
2
1
Population living in slums, (% of urban population)
2015,2010,2008,2006,2001,1996,1991
Download
Biblioteca de estatísticas globais →IDA total →

Population living in slums, (% of urban population)

Estas estatísticas em outros países:

AfghanistanAlgeriaAngolaAntigua and BarbudaArab WorldArgentinaArmeniaBangladeshBelizeBeninBhutanBoliviaBotswanaBrazilBurkina FasoBurundiCabo VerdeCambodiaCameroonCaribbean small statesCentral African RepublicChadChileChinaColombiaComorosCongo, Dem. Rep.Congo, Rep.Costa RicaCote d'IvoireDjiboutiDominicaDominican RepublicEarly-demographic dividendEast Asia & PacificEast Asia & Pacific (excluding high income)East Asia & Pacific (IDA & IBRD countries)EcuadorEgypt, Arab Rep.El SalvadorEquatorial GuineaEritreaEthiopiaFragile and conflict affected situationsGabonGambia, TheGhanaGrenadaGuatemalaGuineaGuinea-BissauGuyanaHaitiHeavily indebted poor countries (HIPC)HondurasIBRD onlyIDA & IBRD totalIDA blendIDA onlyIDA totalIndiaIndonesiaIran, Islamic Rep.IraqJamaicaJordanKenyaKorea, Dem. People’s Rep.Lao PDRLate-demographic dividendLatin America & Caribbean Latin America & Caribbean (excluding high income)Latin America & the Caribbean (IDA & IBRD countries)Least developed countries: UN classificationLebanonLesothoLiberiaLibyaLow & middle incomeLow incomeLower middle incomeMadagascarMalawiMaliMauritaniaMexicoMiddle East & North AfricaMiddle East & North Africa (excluding high income)Middle East & North Africa (IDA & IBRD countries)Middle incomeMongoliaMoroccoMozambiqueMyanmarNamibiaNepalNicaraguaNigerNigeriaOmanPakistanPanamaParaguayPeruPhilippinesPre-demographic dividendRwandaSao Tome and PrincipeSaudi ArabiaSenegalSierra LeoneSomaliaSouth AfricaSouth AsiaSouth Asia (IDA & IBRD)South SudanSri LankaSt. LuciaSub-Saharan Africa Sub-Saharan Africa (excluding high income)Sub-Saharan Africa (IDA & IBRD countries)SudanSurinameSwazilandSyrian Arab RepublicTanzaniaThailandTogoTrinidad and TobagoTunisiaTurkeyUgandaUpper middle incomeVenezuela, RBVietnamYemen, Rep.ZambiaZimbabwe

Linha do tempo:

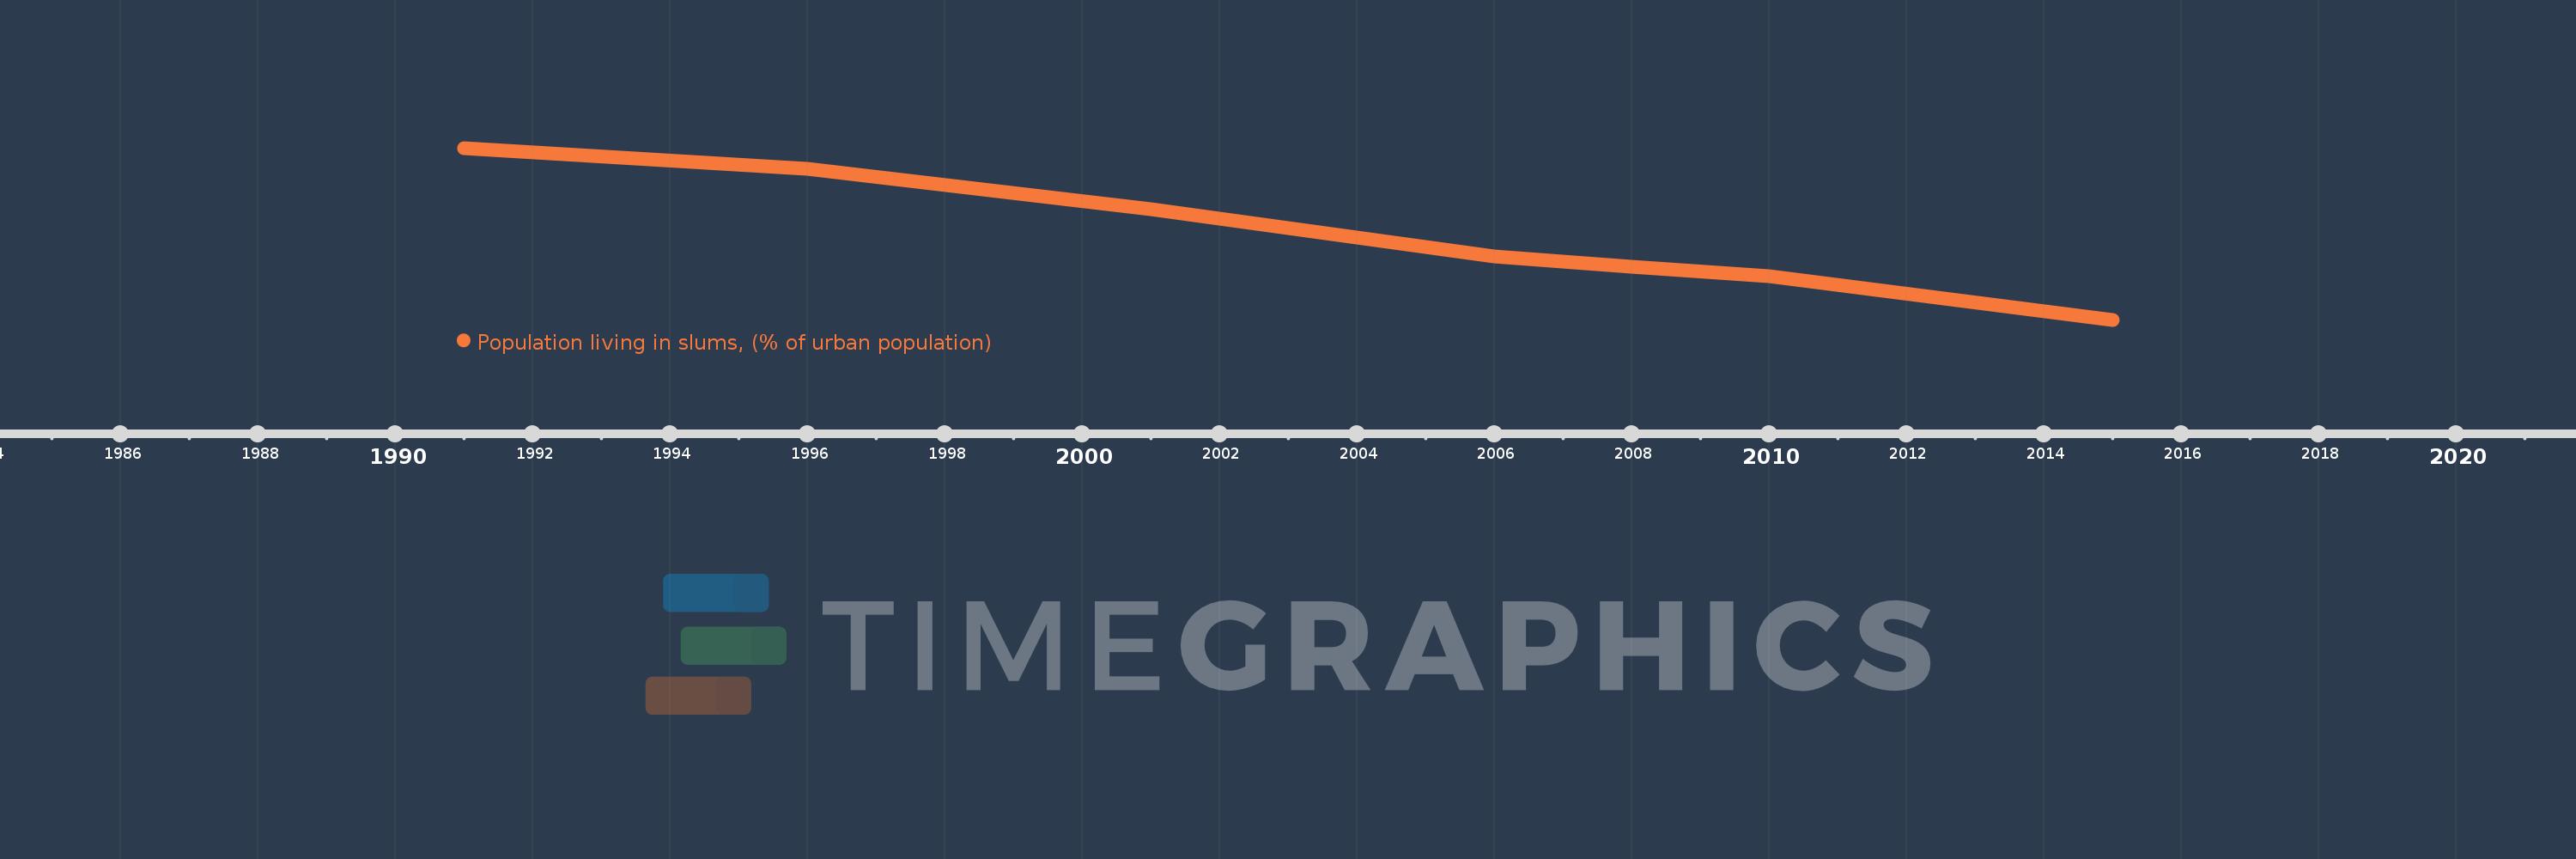
Nesta escala de tempo está apresentado um gráfico de 1991 ano até 2015 ano IDA total. Dados de 1990 ano ausente. O número de observações reais por data: 7.

Fonte (nome):

Indicadores de desenvolvimento mundial

Fonte (organização):

UN HABITAT, retrieved from the United Nation's Millennium Development Goals database. Data are available at: Http://mdgs.un.org

Categorias:

Poverty, Urban Development, Environment

Foi atualizado:

23 abr 2017 ano

Indicadores de alterações dos valores ao longo dos anos

Em média:
60.609
Mínimo:
53.292
1 jan 2015 ano
Máximo:
68.143
1 jan 1991 ano
Na data de observação
Valor
Mudança absoluta
A alteração em relação ao valor anterior
1 jan 1991 ano
68.143
+68.143
0.0%
1 jan 1996 ano
66.305
-1.838
-2.7%
1 jan 2001 ano
62.826
-3.48
-5.25%
1 jan 2006 ano
58.79
-4.036
-6.42%
1 jan 2008 ano
57.856
-0.935
-1.59%
1 jan 2010 ano
57.052
-0.804
-1.39%
1 jan 2015 ano
53.292
-3.76
-6.59%

Classificação de países por estatísticas atuais por anos