33
/pt/
AIzaSyB4mHJ5NPEv-XzF7P6NDYXjlkCWaeKw5bc
November 30, 2025
222713
Peru
PER
true
2
1
Population living in slums, (% of urban population)
2015,2008,2006,2001,1996,1991
Create a timeline
Public Timelines
For education
For educational institutions
For teachers
For students
Cabinet
For educational institutions
For teachers
For students
Open cabinet
FAQ
Close
Create a timeline
Public timelines
FAQ
About & Feedback
Acordo
Privacidade
FAQ
Support 24/7
Cabinet
Get premium
Donate
Download
Biblioteca de estatísticas globais
→
Peru
→
Population living in slums, (% of urban population)
Estas estatísticas em outros países:
Afghanistan
Algeria
Angola
Antigua and Barbuda
Arab World
Argentina
Armenia
Bangladesh
Belize
Benin
Bhutan
Bolivia
Botswana
Brazil
Burkina Faso
Burundi
Cabo Verde
Cambodia
Cameroon
Caribbean small states
Central African Republic
Chad
Chile
China
Colombia
Comoros
Congo, Dem. Rep.
Congo, Rep.
Costa Rica
Cote d'Ivoire
Djibouti
Dominica
Dominican Republic
Early-demographic dividend
East Asia & Pacific
East Asia & Pacific (excluding high income)
East Asia & Pacific (IDA & IBRD countries)
Ecuador
Egypt, Arab Rep.
El Salvador
Equatorial Guinea
Eritrea
Ethiopia
Fragile and conflict affected situations
Gabon
Gambia, The
Ghana
Grenada
Guatemala
Guinea
Guinea-Bissau
Guyana
Haiti
Heavily indebted poor countries (HIPC)
Honduras
IBRD only
IDA & IBRD total
IDA blend
IDA only
IDA total
India
Indonesia
Iran, Islamic Rep.
Iraq
Jamaica
Jordan
Kenya
Korea, Dem. People’s Rep.
Lao PDR
Late-demographic dividend
Latin America & Caribbean
Latin America & Caribbean (excluding high income)
Latin America & the Caribbean (IDA & IBRD countries)
Least developed countries: UN classification
Lebanon
Lesotho
Liberia
Libya
Low & middle income
Low income
Lower middle income
Madagascar
Malawi
Mali
Mauritania
Mexico
Middle East & North Africa
Middle East & North Africa (excluding high income)
Middle East & North Africa (IDA & IBRD countries)
Middle income
Mongolia
Morocco
Mozambique
Myanmar
Namibia
Nepal
Nicaragua
Niger
Nigeria
Oman
Pakistan
Panama
Paraguay
Peru
Philippines
Pre-demographic dividend
Rwanda
Sao Tome and Principe
Saudi Arabia
Senegal
Sierra Leone
Somalia
South Africa
South Asia
South Asia (IDA & IBRD)
South Sudan
Sri Lanka
St. Lucia
Sub-Saharan Africa
Sub-Saharan Africa (excluding high income)
Sub-Saharan Africa (IDA & IBRD countries)
Sudan
Suriname
Swaziland
Syrian Arab Republic
Tanzania
Thailand
Togo
Trinidad and Tobago
Tunisia
Turkey
Uganda
Upper middle income
Venezuela, RB
Vietnam
Yemen, Rep.
Zambia
Zimbabwe
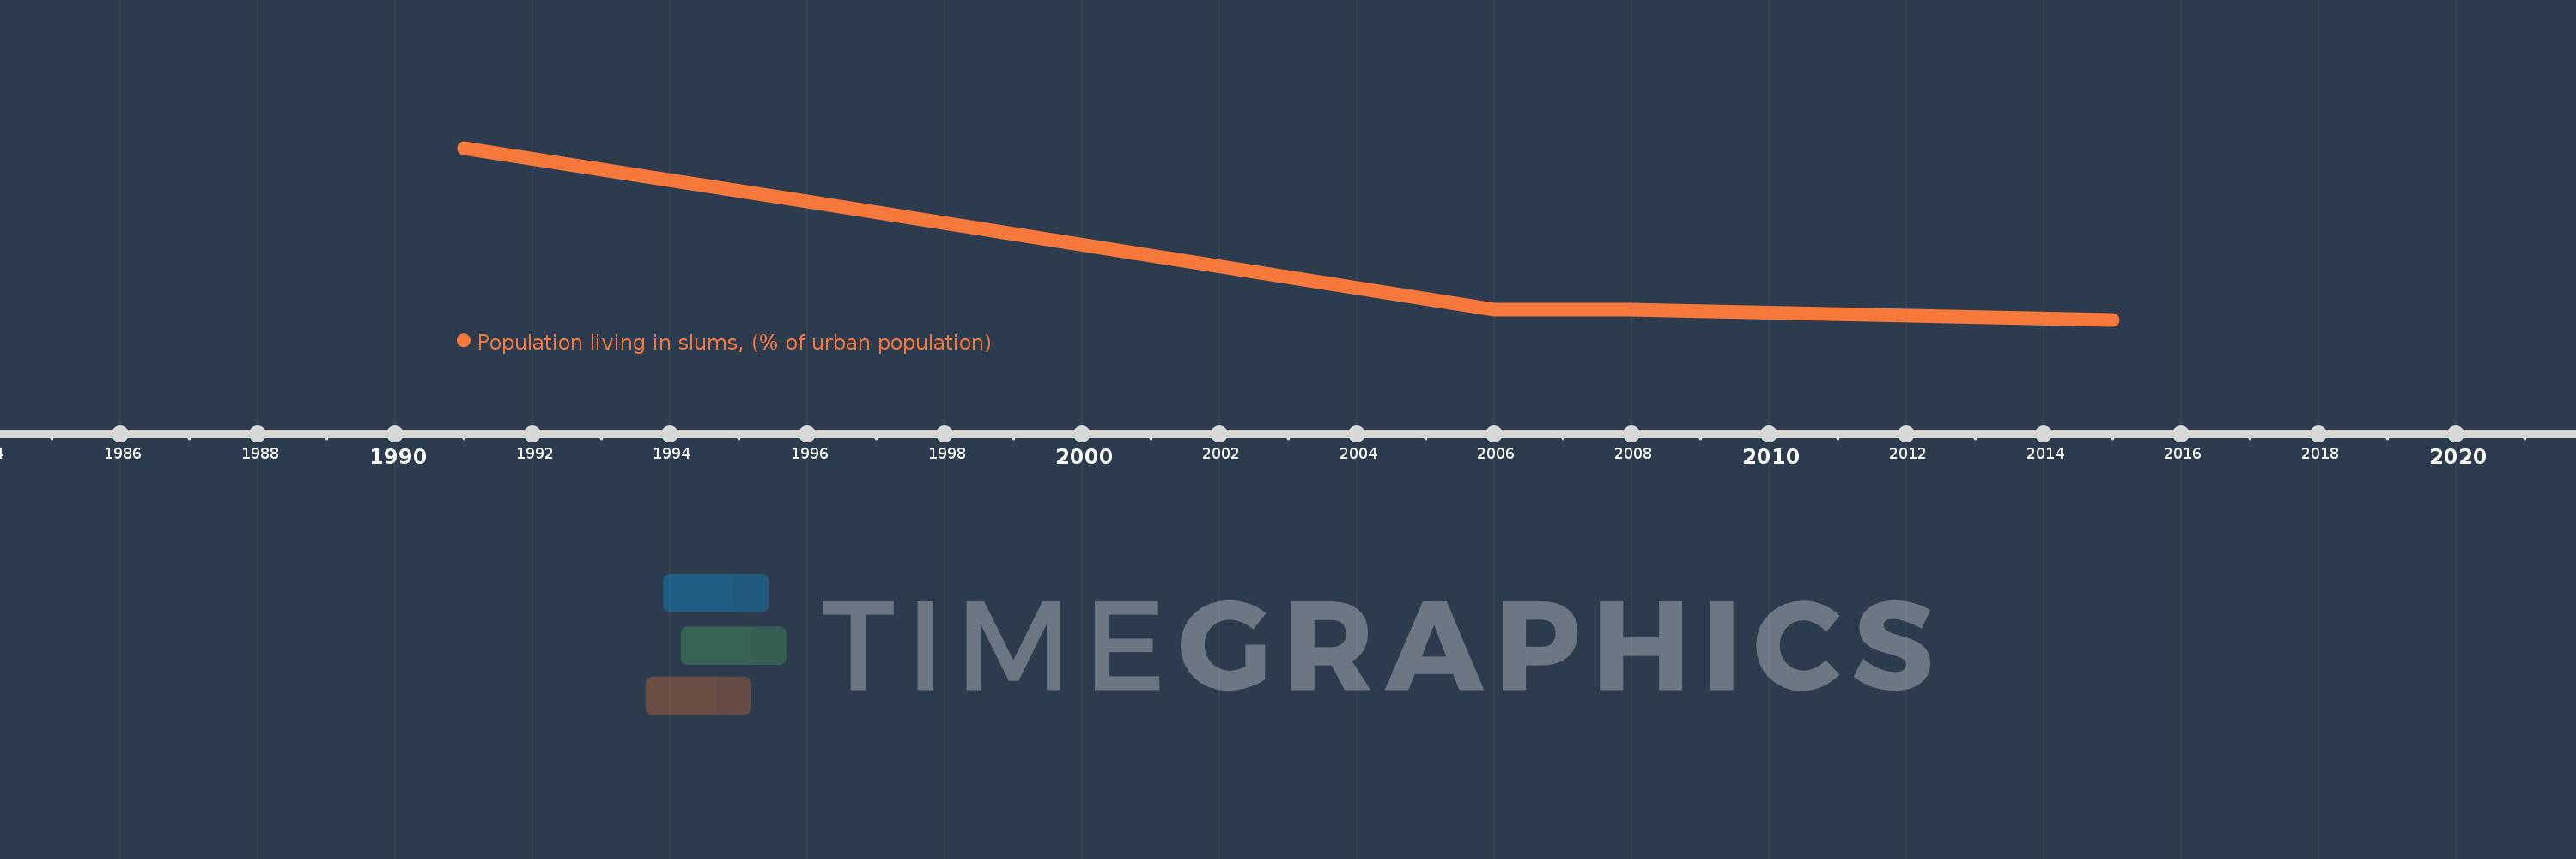
Linha do tempo:
Nesta escala de tempo está apresentado um gráfico de
1991
ano até
2015
ano Peru. Dados de
1990
ano ausente. O número de observações reais por data:
6
.
Fonte (nome):
Indicadores de desenvolvimento mundial
Fonte (organização):
UN HABITAT, retrieved from the United Nation's Millennium Development Goals database. Data are available at: Http://mdgs.un.org
Categorias:
Poverty, Urban Development, Environment
Foi atualizado:
23 abr 2017 ano
Indicadores de alterações dos valores ao longo dos anos
Em média:
45.883
Mínimo:
34.2
1 jan 2015 ano
Máximo:
66.4
1 jan 1991 ano
Na data de observação
Valor
Mudança absoluta
A alteração em relação ao valor anterior
1 jan 1991 ano
66.4
+66.4
0.0%
1 jan 1996 ano
56.3
-10.1
-15.21%
1 jan 2001 ano
46.2
-10.1
-17.94%
1 jan 2006 ano
36.1
-10.1
-21.86%
1 jan 2008 ano
36.1
0.0
0.0%
1 jan 2015 ano
34.2
-1.9
-5.26%
Classificação de países por estatísticas atuais por anos
About & Feedback
Acordo
Privacidade
FAQ
Support 24/7
Cabinet
Get premium
Donate
The service accepts bank transfer (ACH, Wire) or cards (Visa, MasterCard, etc). Processed by Stripe.
Secured with SSL