33
/pt/
AIzaSyAYiBZKx7MnpbEhh9jyipgxe19OcubqV5w
August 1, 2025
36968
IBRD only
IBD
false
2
1
Research and development expenditure (% of GDP)
2015,2014,2013,2012,2011,2010,2009,2008,2007,2006,2005,2004,2003,2002,2001,2000,1998
Download
Biblioteca de estatísticas globais →IBRD only →

Research and development expenditure (% of GDP)

Estas estatísticas em outros países:

AlbaniaAlgeriaArgentinaArmeniaAustraliaAustriaAzerbaijanBahrainBelarusBelgiumBermudaBoliviaBosnia and HerzegovinaBotswanaBrazilBrunei DarussalamBulgariaBurkina FasoBurundiCabo VerdeCambodiaCanadaCentral Europe and the BalticsChileChinaColombiaCongo, Dem. Rep.Costa RicaCroatiaCubaCyprusCzech RepublicDenmarkEarly-demographic dividendEast Asia & PacificEast Asia & Pacific (excluding high income)East Asia & Pacific (IDA & IBRD countries)EcuadorEgypt, Arab Rep.El SalvadorEstoniaEthiopiaEuro areaEurope & Central AsiaEurope & Central Asia (excluding high income)Europe & Central Asia (IDA & IBRD countries)European UnionFaroe IslandsFinlandFranceGabonGambia, TheGeorgiaGermanyGhanaGreeceGreenlandGuatemalaHigh incomeHondurasHong Kong SAR, ChinaHungaryIBRD onlyIcelandIDA & IBRD totalIndiaIndonesiaIran, Islamic Rep.IraqIrelandIsraelItalyJamaicaJapanJordanKazakhstanKenyaKorea, Rep.KuwaitKyrgyz RepublicLao PDRLate-demographic dividendLatin America & Caribbean Latin America & Caribbean (excluding high income)Latin America & the Caribbean (IDA & IBRD countries)LatviaLesothoLithuaniaLow & middle incomeLower middle incomeLuxembourgMacao SAR, ChinaMacedonia, FYRMadagascarMalaysiaMaliMaltaMauritiusMexicoMiddle East & North Africa (excluding high income)Middle East & North Africa (IDA & IBRD countries)Middle incomeMoldovaMonacoMongoliaMontenegroMoroccoMozambiqueMyanmarNamibiaNepalNetherlandsNew ZealandNicaraguaNigeriaNorth AmericaNorwayOECD membersOmanPakistanPanamaParaguayPeruPhilippinesPolandPortugalPost-demographic dividendPuerto RicoQatarRomaniaRussian FederationSaudi ArabiaSenegalSerbiaSeychellesSingaporeSlovak RepublicSloveniaSouth AfricaSouth AsiaSouth Asia (IDA & IBRD)SpainSri LankaSt. LuciaSt. Vincent and the GrenadinesSub-Saharan Africa Sub-Saharan Africa (excluding high income)Sub-Saharan Africa (IDA & IBRD countries)SudanSwedenSwitzerlandTajikistanTanzaniaThailandTogoTrinidad and TobagoTunisiaTurkeyUgandaUkraineUnited Arab EmiratesUnited KingdomUnited StatesUpper middle incomeUruguayUzbekistanVietnamWorldZambia

Linha do tempo:

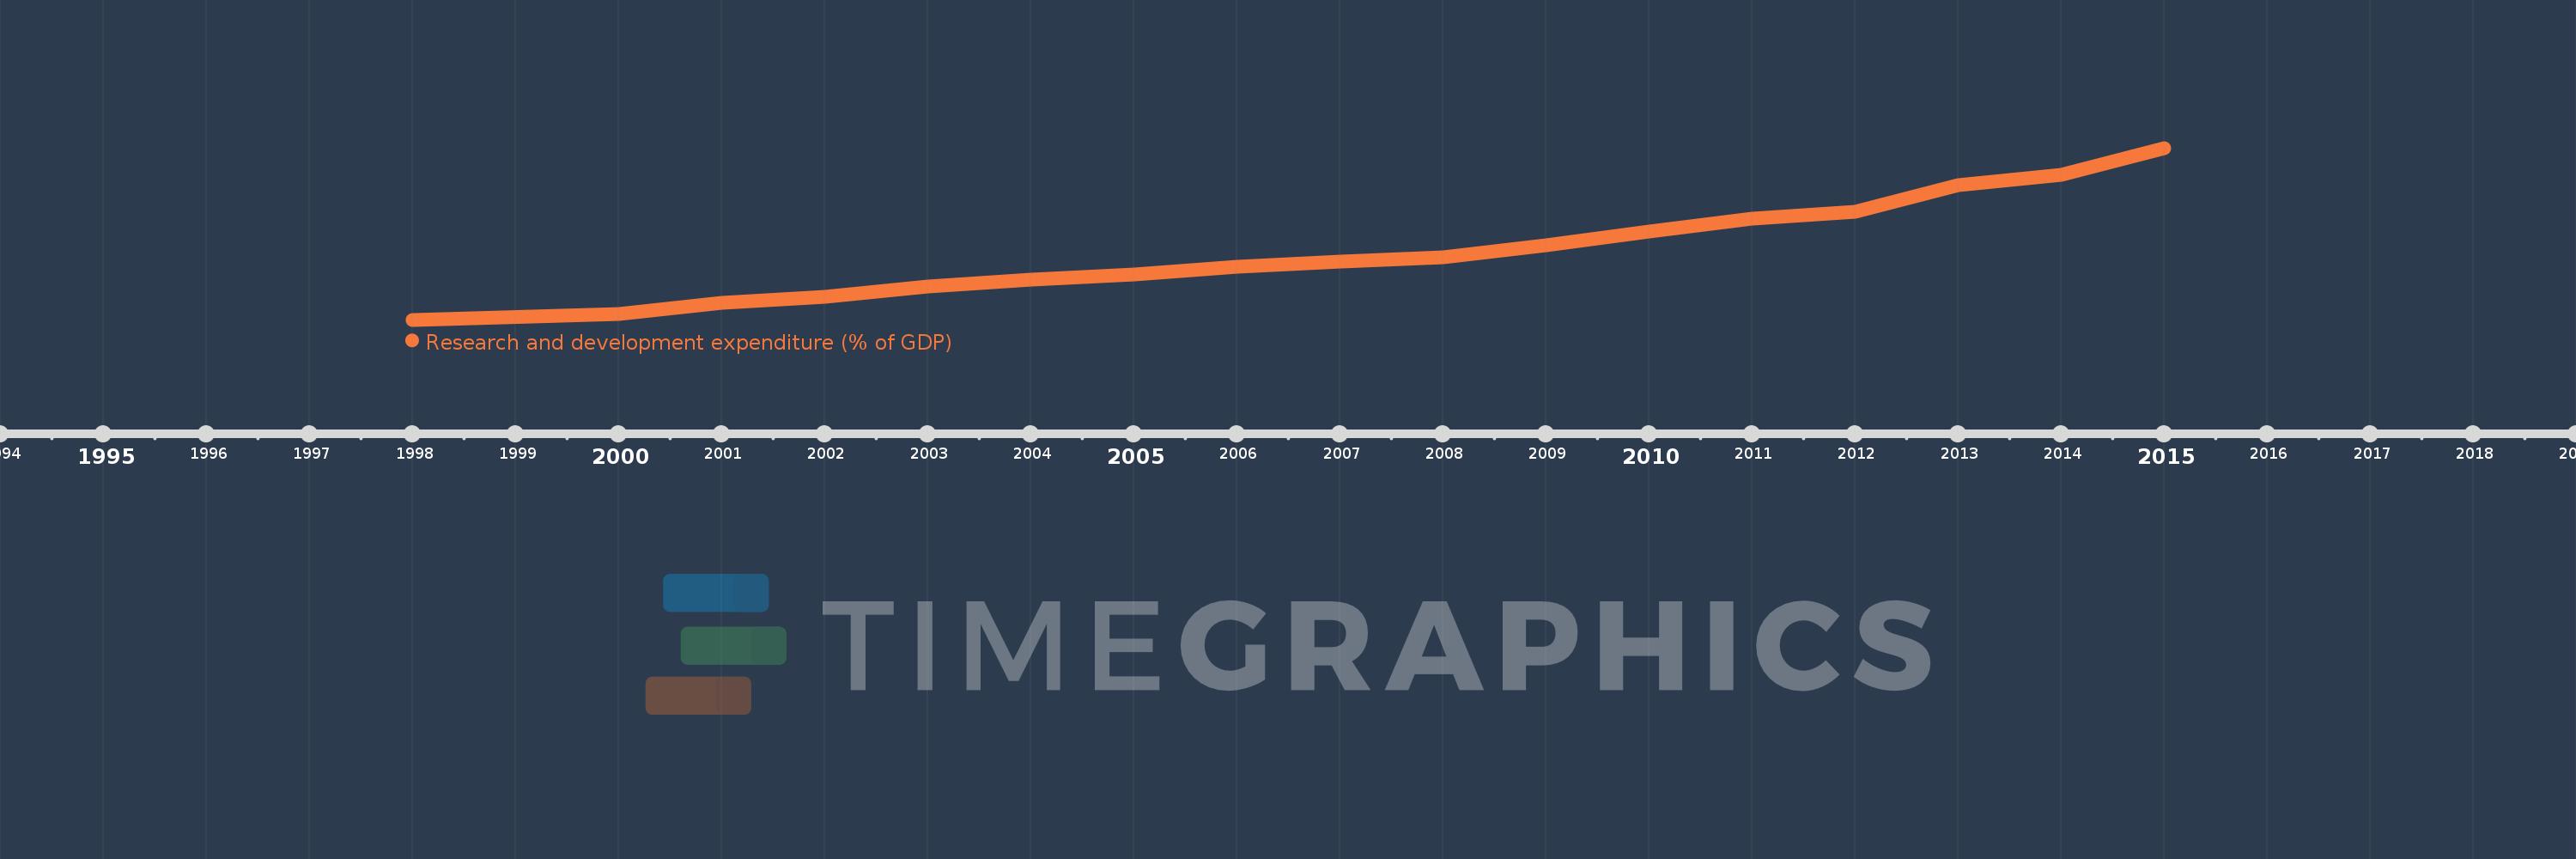
Nesta escala de tempo está apresentado um gráfico de 1998 ano até 2015 ano IBRD only. Dados de 1997 ano ausente. O número de observações reais por data: 17.

Fonte (nome):

Indicadores de desenvolvimento mundial

Fonte (organização):

United Nations Educational, Scientific, and Cultural Organization (UNESCO) Institute for Statistics.

Categorias:

Science & Technology

Foi atualizado:

23 abr 2017 ano

Indicadores de alterações dos valores ao longo dos anos

Em média:
0.934
Mínimo:
0.56
1 jan 1998 ano
Máximo:
1.501
1 jan 2015 ano
Na data de observação
Valor
Mudança absoluta
A alteração em relação ao valor anterior
1 jan 1998 ano
0.56
+0.56
0.0%
1 jan 2000 ano
0.593
+0.033
5.91%
1 jan 2001 ano
0.655
+0.061
10.31%
1 jan 2002 ano
0.687
+0.032
4.94%
1 jan 2003 ano
0.741
+0.054
7.83%
1 jan 2004 ano
0.778
+0.037
5.04%
1 jan 2005 ano
0.808
+0.03
3.8%
1 jan 2006 ano
0.851
+0.043
5.34%
1 jan 2007 ano
0.878
+0.028
3.24%
1 jan 2008 ano
0.903
+0.025
2.85%
1 jan 2009 ano
0.968
+0.064
7.14%
1 jan 2010 ano
1.041
+0.073
7.54%
1 jan 2011 ano
1.113
+0.073
6.98%
1 jan 2012 ano
1.152
+0.038
3.41%
1 jan 2013 ano
1.297
+0.145
12.63%
1 jan 2014 ano
1.354
+0.057
4.37%
1 jan 2015 ano
1.501
+0.147
10.88%

Classificação de países por estatísticas atuais por anos