33
/pt/
AIzaSyAYiBZKx7MnpbEhh9jyipgxe19OcubqV5w
August 1, 2025
160955
Israel
ISR
true
2
1
Research and development expenditure (% of GDP)
2015,2014,2013,2012,2011,2010,2009,2008,2007,2006,2005,2004,2003,2002,2001,2000,1999,1998,1997
Download
Biblioteca de estatísticas globais →Israel →

Research and development expenditure (% of GDP)

Estas estatísticas em outros países:

AlbaniaAlgeriaArgentinaArmeniaAustraliaAustriaAzerbaijanBahrainBelarusBelgiumBermudaBoliviaBosnia and HerzegovinaBotswanaBrazilBrunei DarussalamBulgariaBurkina FasoBurundiCabo VerdeCambodiaCanadaCentral Europe and the BalticsChileChinaColombiaCongo, Dem. Rep.Costa RicaCroatiaCubaCyprusCzech RepublicDenmarkEarly-demographic dividendEast Asia & PacificEast Asia & Pacific (excluding high income)East Asia & Pacific (IDA & IBRD countries)EcuadorEgypt, Arab Rep.El SalvadorEstoniaEthiopiaEuro areaEurope & Central AsiaEurope & Central Asia (excluding high income)Europe & Central Asia (IDA & IBRD countries)European UnionFaroe IslandsFinlandFranceGabonGambia, TheGeorgiaGermanyGhanaGreeceGreenlandGuatemalaHigh incomeHondurasHong Kong SAR, ChinaHungaryIBRD onlyIcelandIDA & IBRD totalIndiaIndonesiaIran, Islamic Rep.IraqIrelandIsraelItalyJamaicaJapanJordanKazakhstanKenyaKorea, Rep.KuwaitKyrgyz RepublicLao PDRLate-demographic dividendLatin America & Caribbean Latin America & Caribbean (excluding high income)Latin America & the Caribbean (IDA & IBRD countries)LatviaLesothoLithuaniaLow & middle incomeLower middle incomeLuxembourgMacao SAR, ChinaMacedonia, FYRMadagascarMalaysiaMaliMaltaMauritiusMexicoMiddle East & North Africa (excluding high income)Middle East & North Africa (IDA & IBRD countries)Middle incomeMoldovaMonacoMongoliaMontenegroMoroccoMozambiqueMyanmarNamibiaNepalNetherlandsNew ZealandNicaraguaNigeriaNorth AmericaNorwayOECD membersOmanPakistanPanamaParaguayPeruPhilippinesPolandPortugalPost-demographic dividendPuerto RicoQatarRomaniaRussian FederationSaudi ArabiaSenegalSerbiaSeychellesSingaporeSlovak RepublicSloveniaSouth AfricaSouth AsiaSouth Asia (IDA & IBRD)SpainSri LankaSt. LuciaSt. Vincent and the GrenadinesSub-Saharan Africa Sub-Saharan Africa (excluding high income)Sub-Saharan Africa (IDA & IBRD countries)SudanSwedenSwitzerlandTajikistanTanzaniaThailandTogoTrinidad and TobagoTunisiaTurkeyUgandaUkraineUnited Arab EmiratesUnited KingdomUnited StatesUpper middle incomeUruguayUzbekistanVietnamWorldZambia

Linha do tempo:

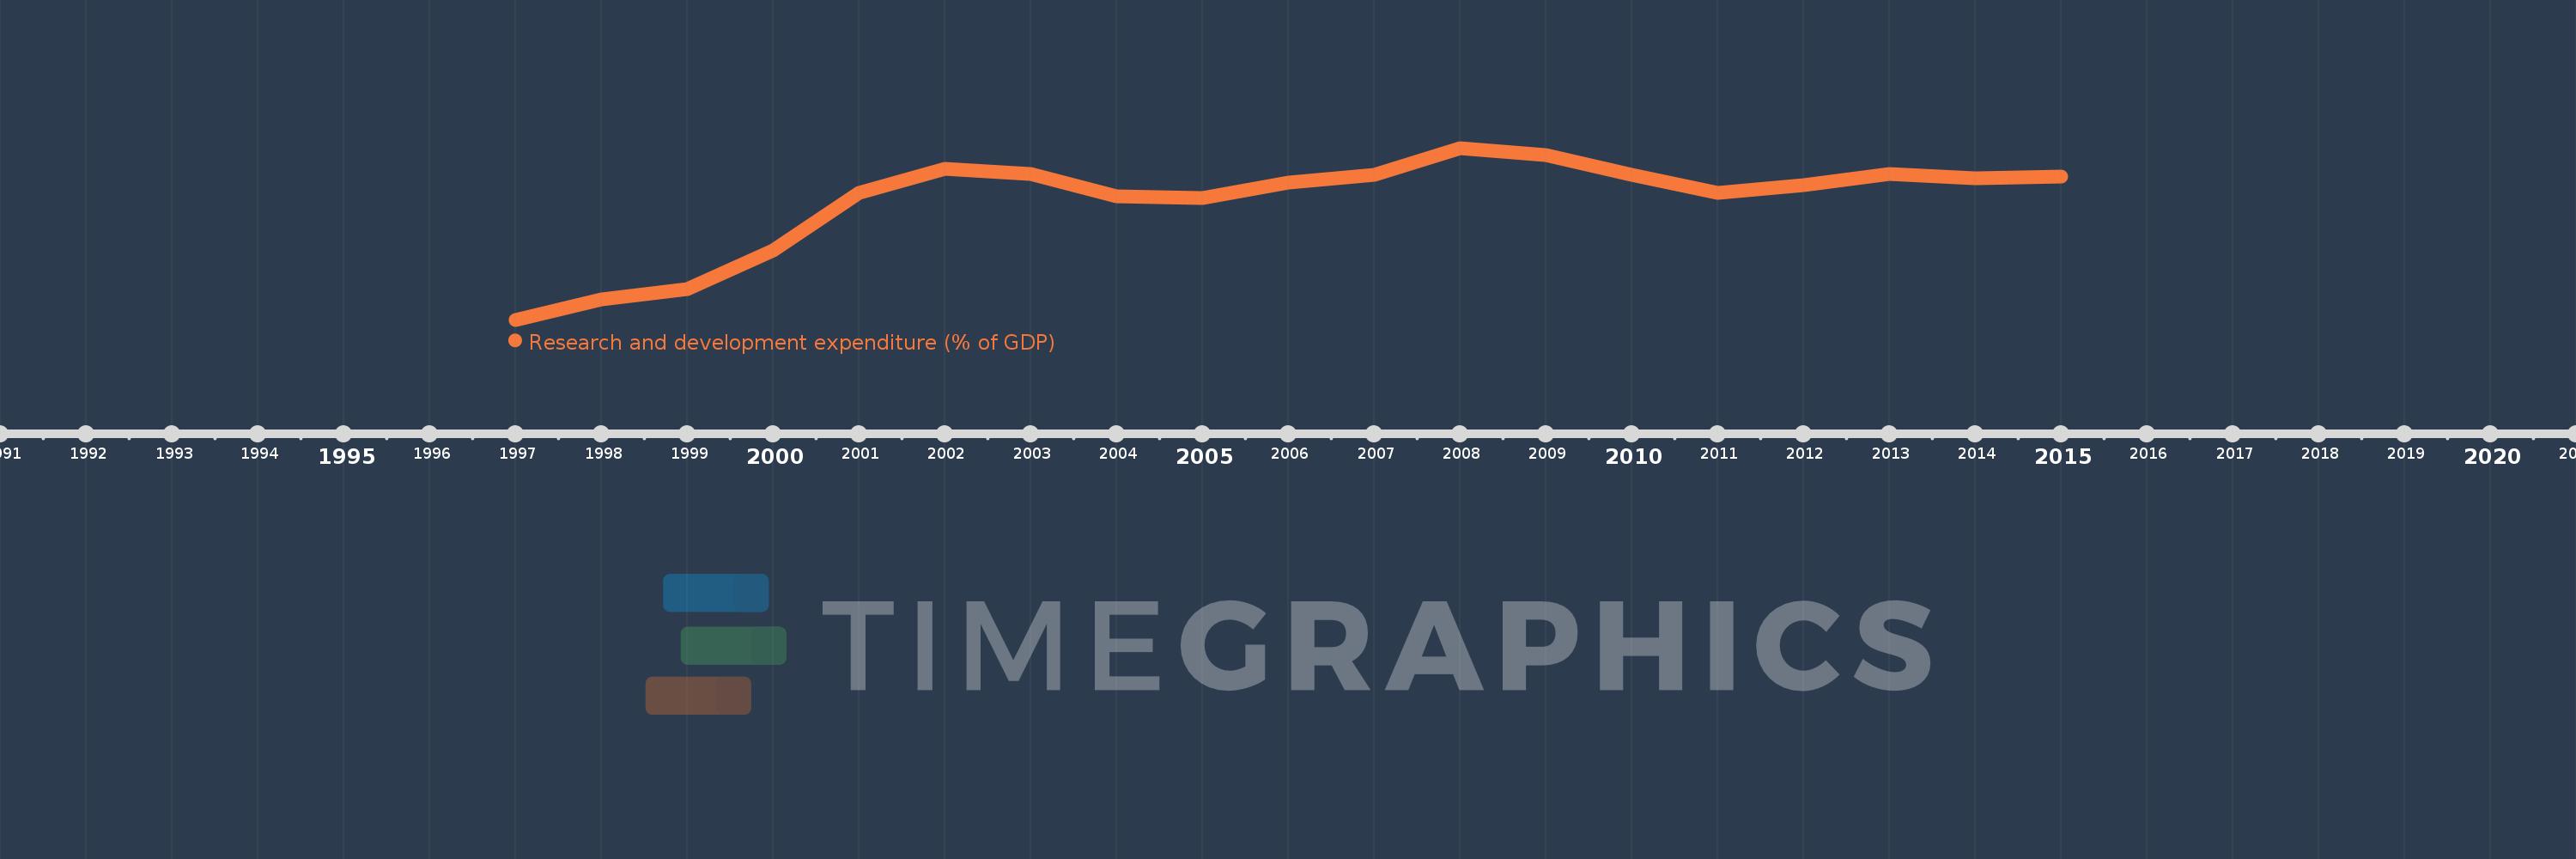
Nesta escala de tempo está apresentado um gráfico de 1997 ano até 2015 ano Israel. Dados de 1996 ano ausente. O número de observações reais por data: 19.

Fonte (nome):

Indicadores de desenvolvimento mundial

Fonte (organização):

United Nations Educational, Scientific, and Cultural Organization (UNESCO) Institute for Statistics.

Categorias:

Science & Technology

Foi atualizado:

23 abr 2017 ano

Indicadores de alterações dos valores ao longo dos anos

Em média:
3.841
Mínimo:
2.596
1 jan 1997 ano
Máximo:
4.407
1 jan 2008 ano
Na data de observação
Valor
Mudança absoluta
A alteração em relação ao valor anterior
1 jan 1997 ano
2.596
+2.596
0.0%
1 jan 1998 ano
2.811
+0.215
8.29%
1 jan 1999 ano
2.921
+0.11
3.93%
1 jan 2000 ano
3.327
+0.406
13.89%
1 jan 2001 ano
3.932
+0.604
18.17%
1 jan 2002 ano
4.185
+0.253
6.45%
1 jan 2003 ano
4.132
-0.053
-1.28%
1 jan 2004 ano
3.9
-0.232
-5.62%
1 jan 2005 ano
3.875
-0.025
-0.63%
1 jan 2006 ano
4.039
+0.164
4.24%
1 jan 2007 ano
4.128
+0.089
2.2%
1 jan 2008 ano
4.407
+0.279
6.76%
1 jan 2009 ano
4.329
-0.078
-1.78%
1 jan 2010 ano
4.121
-0.208
-4.81%
1 jan 2011 ano
3.93
-0.191
-4.64%
1 jan 2012 ano
4.011
+0.081
2.06%
1 jan 2013 ano
4.129
+0.118
2.93%
1 jan 2014 ano
4.088
-0.04
-0.98%
1 jan 2015 ano
4.109
+0.02
0.5%

Classificação de países por estatísticas atuais por anos