33
/pt/
AIzaSyAYiBZKx7MnpbEhh9jyipgxe19OcubqV5w
August 1, 2025
32546
Europe & Central Asia (IDA & IBRD countries)
TEC
false
2
1
Employment to population ratio, ages 15-24, female (%) (national estimate)
2015,2014,2013,2012,2011,2010,2009,2008
Download
Biblioteca de estatísticas globais →Europe & Central Asia (IDA & IBRD countries) →

Employment to population ratio, ages 15-24, female (%) (national estimate)

Estas estatísticas em outros países:

AlbaniaAlgeriaArgentinaArmeniaArubaAustraliaAustriaAzerbaijanBangladeshBarbadosBelarusBelgiumBelizeBeninBhutanBoliviaBosnia and HerzegovinaBotswanaBrazilBulgariaCanadaCayman IslandsCentral Europe and the BalticsChileColombiaCosta RicaCroatiaCyprusCzech RepublicDenmarkDominican RepublicEcuadorEgypt, Arab Rep.El SalvadorEstoniaEthiopiaEuro areaEurope & Central AsiaEurope & Central Asia (excluding high income)Europe & Central Asia (IDA & IBRD countries)European UnionFinlandFranceFrench PolynesiaGabonGambia, TheGermanyGreeceGuamGuatemalaGuineaHigh incomeHondurasHong Kong SAR, ChinaHungaryIcelandIndiaIndonesiaIran, Islamic Rep.IrelandIsle of ManIsraelItalyJapanJordanKiribatiKorea, Rep.KosovoKyrgyz RepublicLatin America & Caribbean Latin America & Caribbean (excluding high income)Latin America & the Caribbean (IDA & IBRD countries)LatviaLesothoLibyaLithuaniaLuxembourgMacao SAR, ChinaMacedonia, FYRMadagascarMalawiMalaysiaMaldivesMaliMaltaMauritiusMexicoMoldovaMongoliaMontenegroMoroccoMozambiqueNamibiaNetherlandsNew ZealandNorth AmericaNorwayOECD membersOmanPanamaParaguayPeruPolandPortugalPost-demographic dividendPuerto RicoQatarRomaniaRussian FederationSamoaSaudi ArabiaSenegalSerbiaSeychellesSlovak RepublicSloveniaSouth AfricaSouth AsiaSouth Asia (IDA & IBRD)South SudanSpainSri LankaSt. LuciaSt. Vincent and the GrenadinesSudanSurinameSwedenSwitzerlandSyrian Arab RepublicTanzaniaThailandTimor-LesteTrinidad and TobagoTunisiaTurkeyUkraineUnited KingdomUnited StatesUruguayVenezuela, RBVietnamWest Bank and GazaYemen, Rep.ZambiaZimbabwe

Linha do tempo:

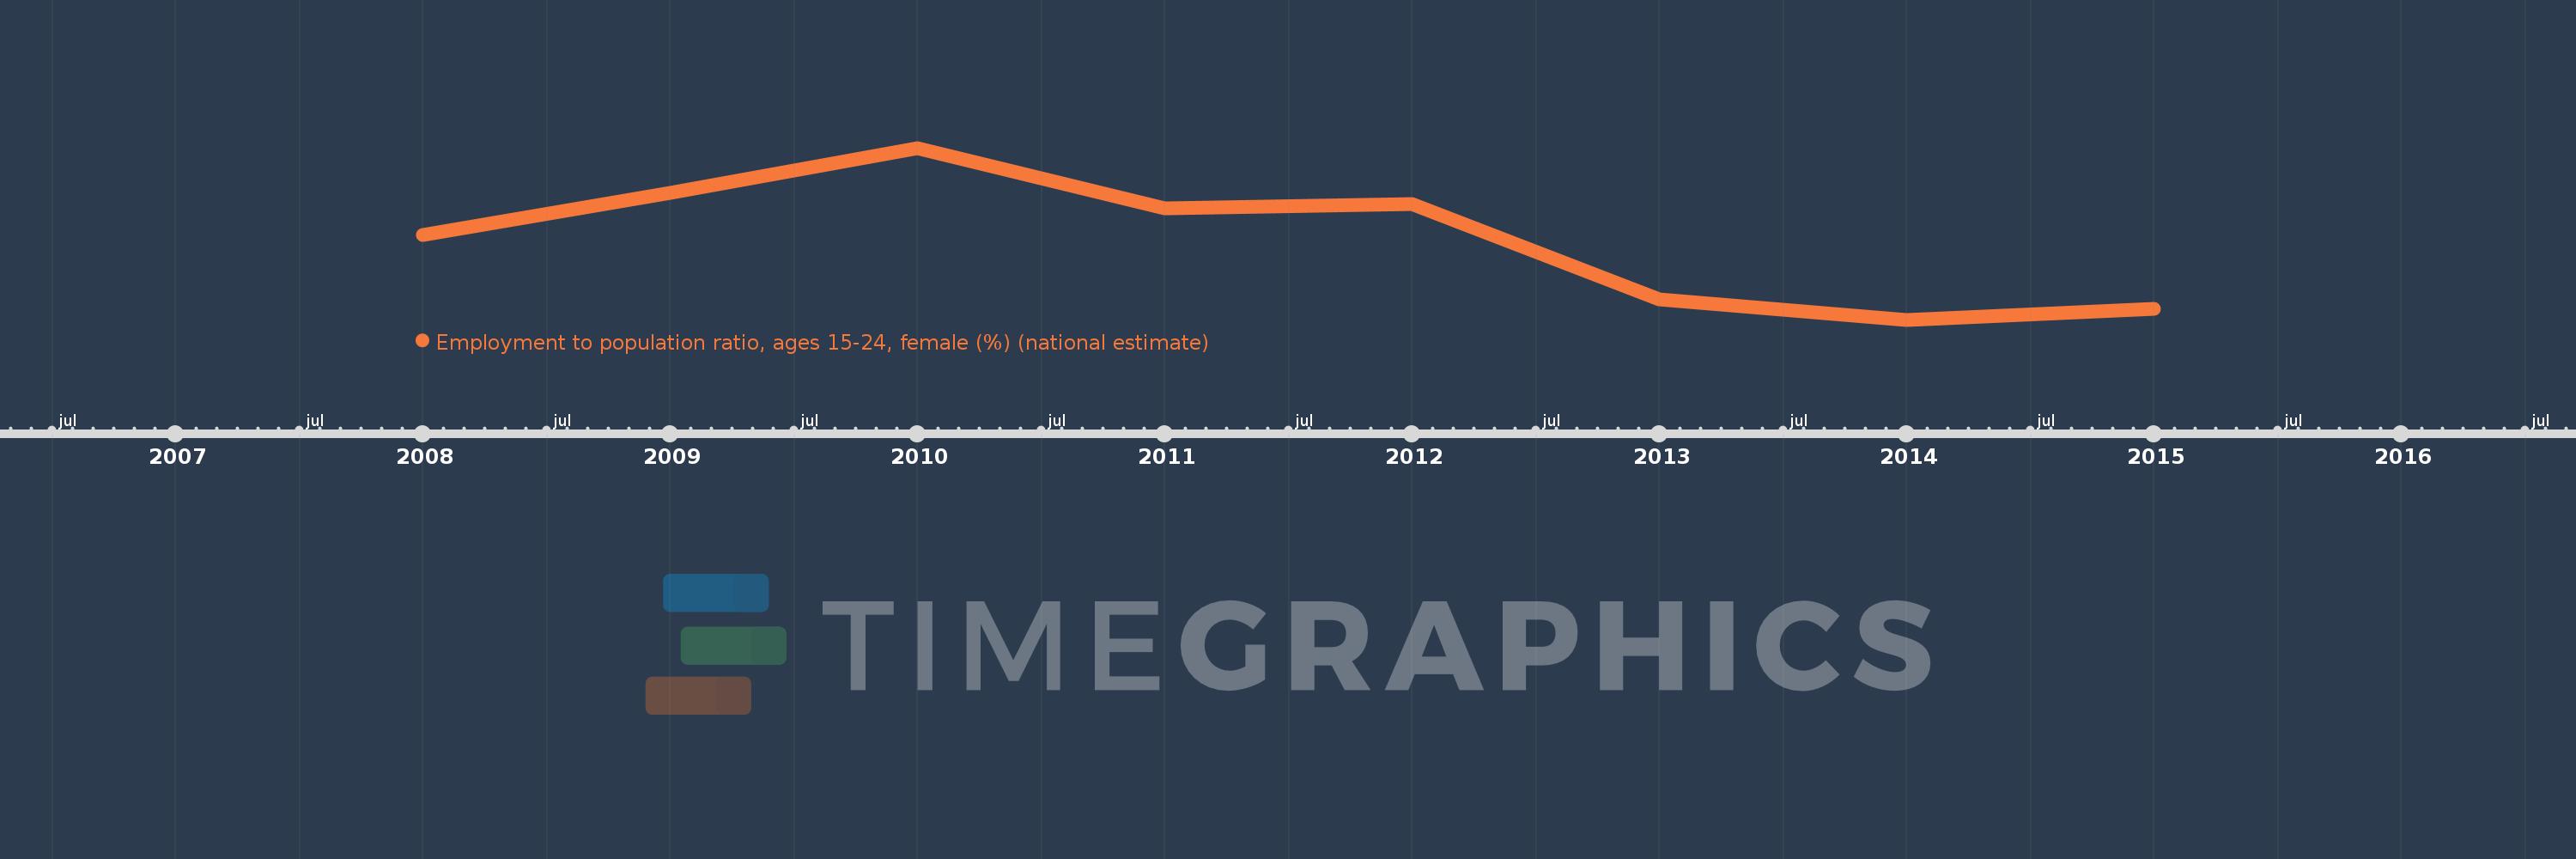
Nesta escala de tempo está apresentado um gráfico de 2008 ano até 2015 ano Europe & Central Asia (IDA & IBRD countries). Dados de 2007 ano ausente. O número de observações reais por data: 8.

Fonte (nome):

Indicadores de desenvolvimento mundial

Fonte (organização):

International Labour Organization, Key Indicators of the Labour Market database.

Categorias:

Social Protection & Labor

Foi atualizado:

23 abr 2017 ano

Indicadores de alterações dos valores ao longo dos anos

Em média:
25.467
Mínimo:
24.494
1 jan 2014 ano
Máximo:
26.577
1 jan 2010 ano
Na data de observação
Valor
Mudança absoluta
A alteração em relação ao valor anterior
1 jan 2008 ano
25.517
+25.517
0.0%
1 jan 2009 ano
26.036
+0.518
2.03%
1 jan 2010 ano
26.577
+0.541
2.08%
1 jan 2011 ano
25.847
-0.73
-2.75%
1 jan 2012 ano
25.899
+0.052
0.2%
1 jan 2013 ano
24.741
-1.158
-4.47%
1 jan 2014 ano
24.494
-0.247
-1.0%
1 jan 2015 ano
24.625
+0.131
0.53%

Classificação de países por estatísticas atuais por anos