33
/pt/
AIzaSyB4mHJ5NPEv-XzF7P6NDYXjlkCWaeKw5bc
November 1, 2025
143753
Guam
GUM
true
2
1
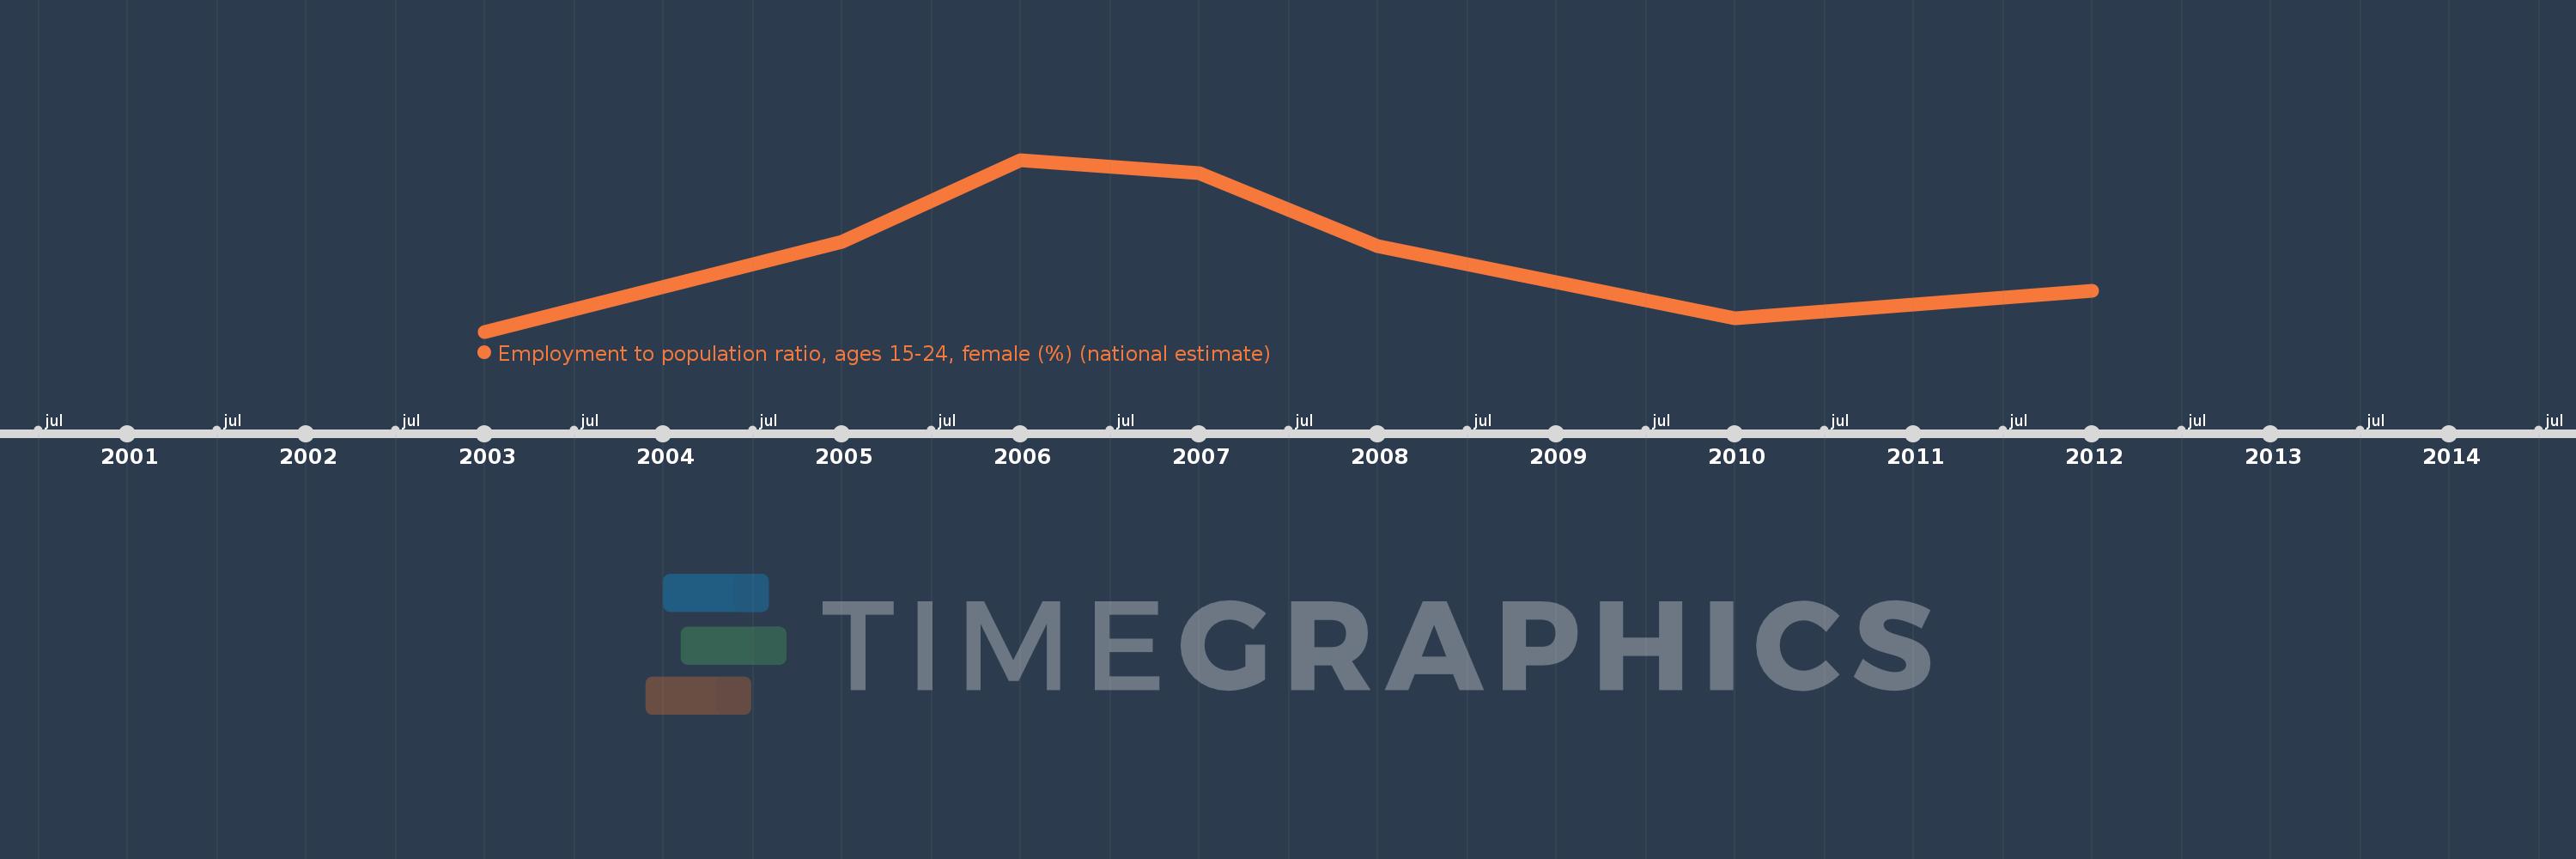
Employment to population ratio, ages 15-24, female (%) (national estimate)
2012,2010,2008,2007,2006,2005,2003
Create a timeline
Public Timelines
For education
For educational institutions
For teachers
For students
Cabinet
For educational institutions
For teachers
For students
Open cabinet
FAQ
Receber premium
Close
Create a timeline
Public timelines
FAQ
About & Feedback
Acordo
Privacidade
FAQ
Support 24/7
Cabinet
Get premium
Donate
Download
Biblioteca de estatísticas globais
→
Guam
→
Employment to population ratio, ages 15-24, female (%) (national estimate)
Estas estatísticas em outros países:
Albania
Algeria
Argentina
Armenia
Aruba
Australia
Austria
Azerbaijan
Bangladesh
Barbados
Belarus
Belgium
Belize
Benin
Bhutan
Bolivia
Bosnia and Herzegovina
Botswana
Brazil
Bulgaria
Canada
Cayman Islands
Central Europe and the Baltics
Chile
Colombia
Costa Rica
Croatia
Cyprus
Czech Republic
Denmark
Dominican Republic
Ecuador
Egypt, Arab Rep.
El Salvador
Estonia
Ethiopia
Euro area
Europe & Central Asia
Europe & Central Asia (excluding high income)
Europe & Central Asia (IDA & IBRD countries)
European Union
Finland
France
French Polynesia
Gabon
Gambia, The
Germany
Greece
Guam
Guatemala
Guinea
High income
Honduras
Hong Kong SAR, China
Hungary
Iceland
India
Indonesia
Iran, Islamic Rep.
Ireland
Isle of Man
Israel
Italy
Japan
Jordan
Kiribati
Korea, Rep.
Kosovo
Kyrgyz Republic
Latin America & Caribbean
Latin America & Caribbean (excluding high income)
Latin America & the Caribbean (IDA & IBRD countries)
Latvia
Lesotho
Libya
Lithuania
Luxembourg
Macao SAR, China
Macedonia, FYR
Madagascar
Malawi
Malaysia
Maldives
Mali
Malta
Mauritius
Mexico
Moldova
Mongolia
Montenegro
Morocco
Mozambique
Namibia
Netherlands
New Zealand
North America
Norway
OECD members
Oman
Panama
Paraguay
Peru
Poland
Portugal
Post-demographic dividend
Puerto Rico
Qatar
Romania
Russian Federation
Samoa
Saudi Arabia
Senegal
Serbia
Seychelles
Slovak Republic
Slovenia
South Africa
South Asia
South Asia (IDA & IBRD)
South Sudan
Spain
Sri Lanka
St. Lucia
St. Vincent and the Grenadines
Sudan
Suriname
Sweden
Switzerland
Syrian Arab Republic
Tanzania
Thailand
Timor-Leste
Trinidad and Tobago
Tunisia
Turkey
Ukraine
United Kingdom
United States
Uruguay
Venezuela, RB
Vietnam
West Bank and Gaza
Yemen, Rep.
Zambia
Zimbabwe
Linha do tempo:
Nesta escala de tempo está apresentado um gráfico de
2003
ano até
2012
ano Guam. Dados de
2002
ano ausente. O número de observações reais por data:
7
.
Fonte (nome):
Indicadores de desenvolvimento mundial
Fonte (organização):
International Labour Organization, Key Indicators of the Labour Market database.
Categorias:
Social Protection & Labor
Foi atualizado:
23 abr 2017 ano
Indicadores de alterações dos valores ao longo dos anos
Em média:
35.314
Mínimo:
28.1
1 jan 2003 ano
Máximo:
43.6
1 jan 2006 ano
Na data de observação
Valor
Mudança absoluta
A alteração em relação ao valor anterior
1 jan 2003 ano
28.1
+28.1
0.0%
1 jan 2005 ano
36.2
+8.1
28.83%
1 jan 2006 ano
43.6
+7.4
20.44%
1 jan 2007 ano
42.4
-1.2
-2.75%
1 jan 2008 ano
35.8
-6.6
-15.57%
1 jan 2010 ano
29.3
-6.5
-18.16%
1 jan 2012 ano
31.8
+2.5
8.53%
Classificação de países por estatísticas atuais por anos
About & Feedback
Acordo
Privacidade
FAQ
Support 24/7
Cabinet
Get premium
Donate
The service accepts bank transfer (ACH, Wire) or cards (Visa, MasterCard, etc). Processed by Stripe.
Secured with SSL