33
/pt/
AIzaSyB4mHJ5NPEv-XzF7P6NDYXjlkCWaeKw5bc
November 1, 2025
287888
Zimbabwe
ZWE
true
2
1
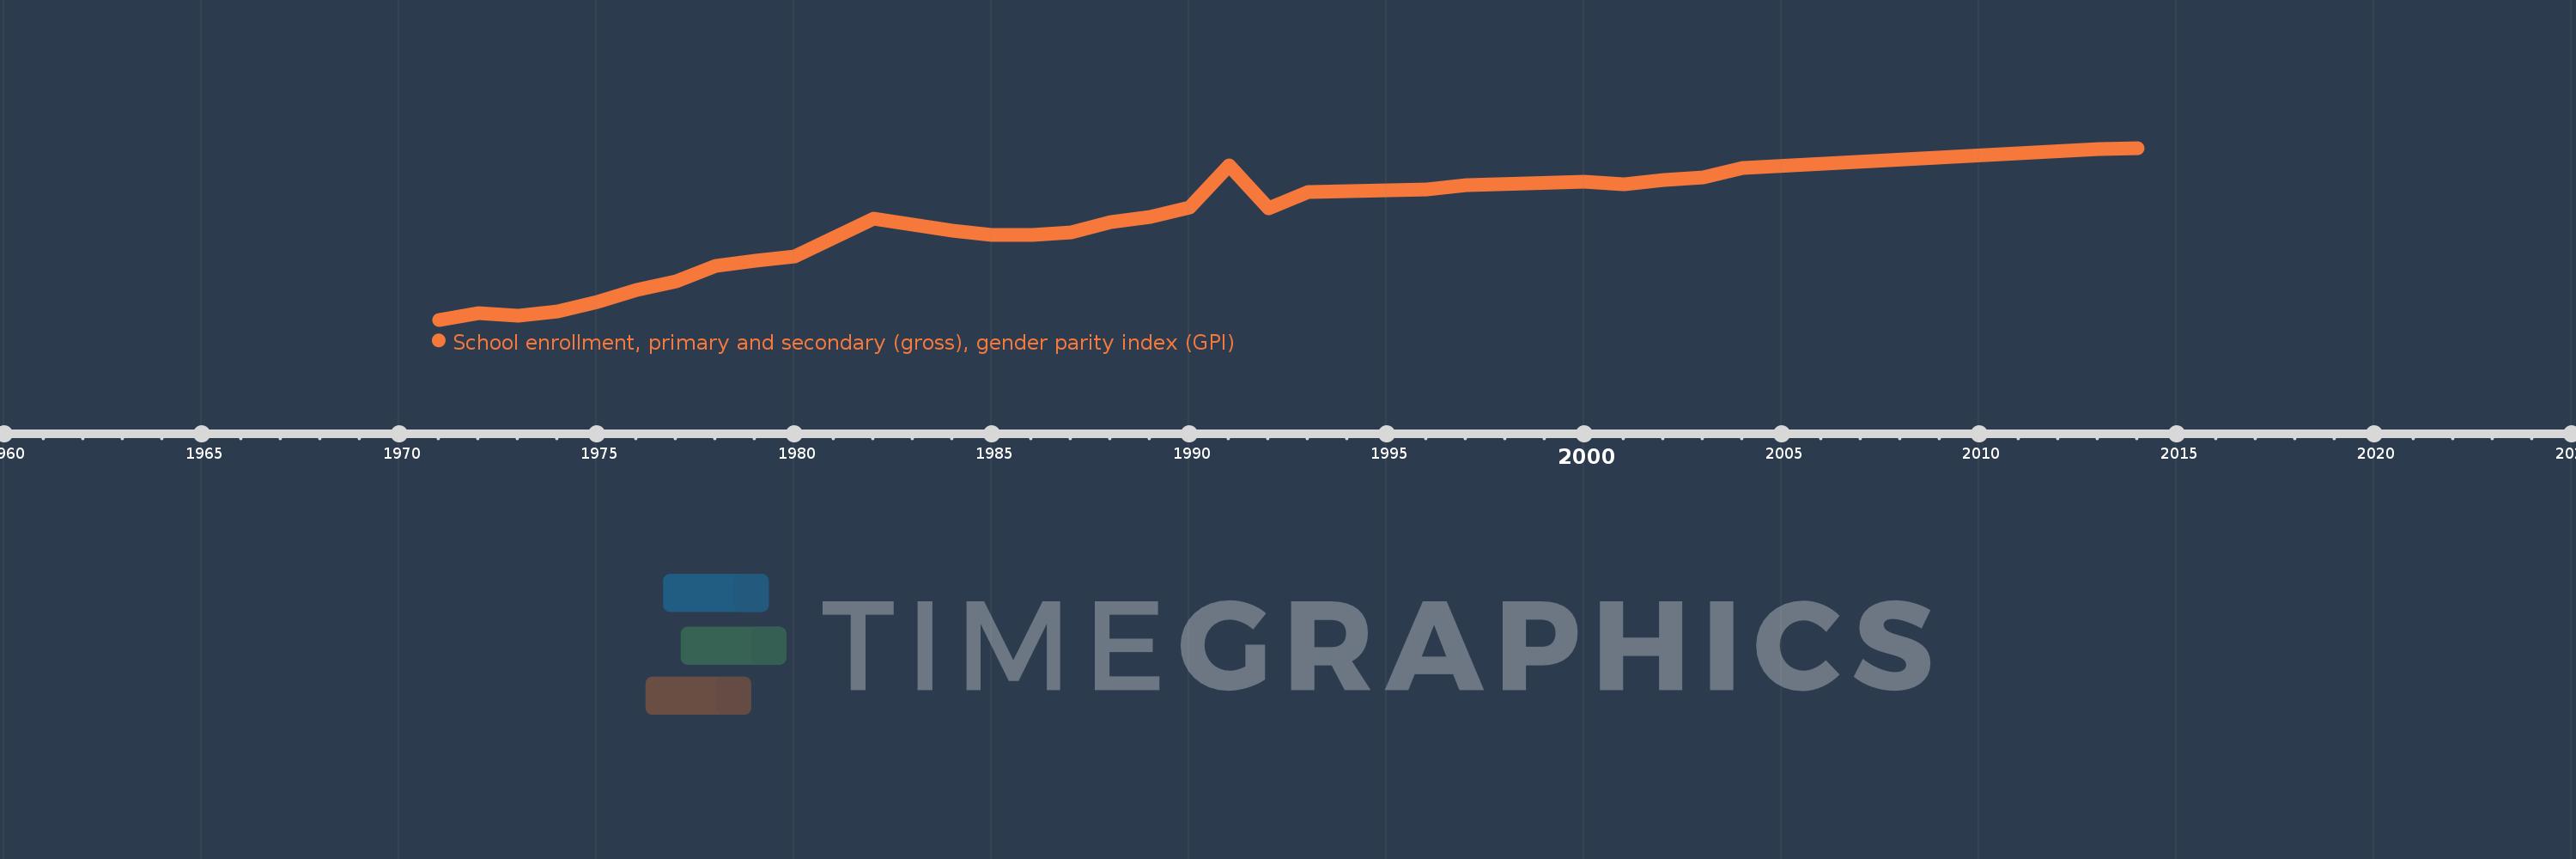
School enrollment, primary and secondary (gross), gender parity index (GPI)
2014,2013,2004,2003,2002,2001,2000,1997,1996,1993,1992,1991,1990,1989,1988,1987,1986,1985,1984,1983,1982,1980,1979,1978,1977,1976,1975,1974,1973,1972,1971