33
/pt/
AIzaSyB4mHJ5NPEv-XzF7P6NDYXjlkCWaeKw5bc
November 1, 2025
143542
Grenada
GRD
true
2
1
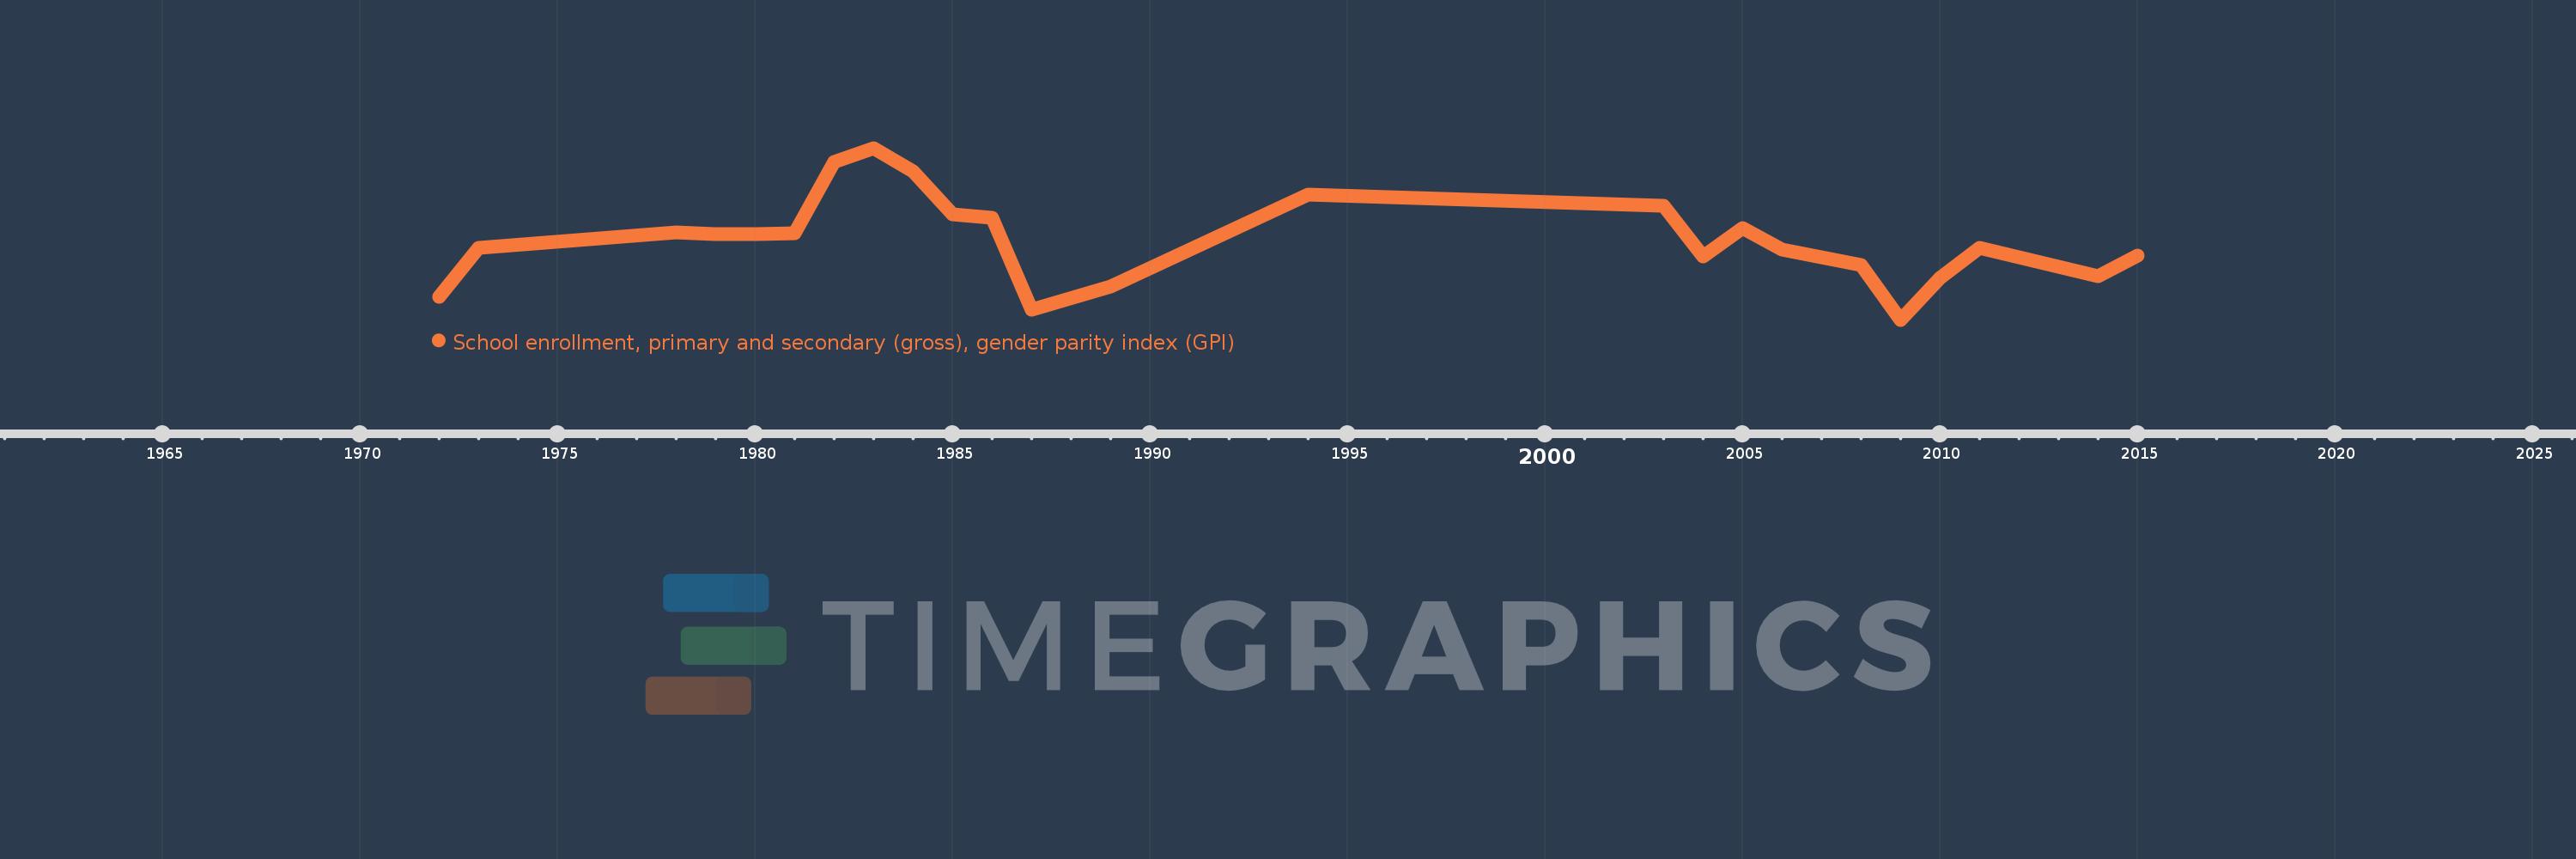
School enrollment, primary and secondary (gross), gender parity index (GPI)
2015,2014,2011,2010,2009,2008,2006,2005,2004,2003,1994,1989,1987,1986,1985,1984,1983,1982,1981,1980,1979,1978,1973,1972