33
/pt/
AIzaSyB4mHJ5NPEv-XzF7P6NDYXjlkCWaeKw5bc
November 1, 2025
285769
Zambia
ZMB
true
2
1
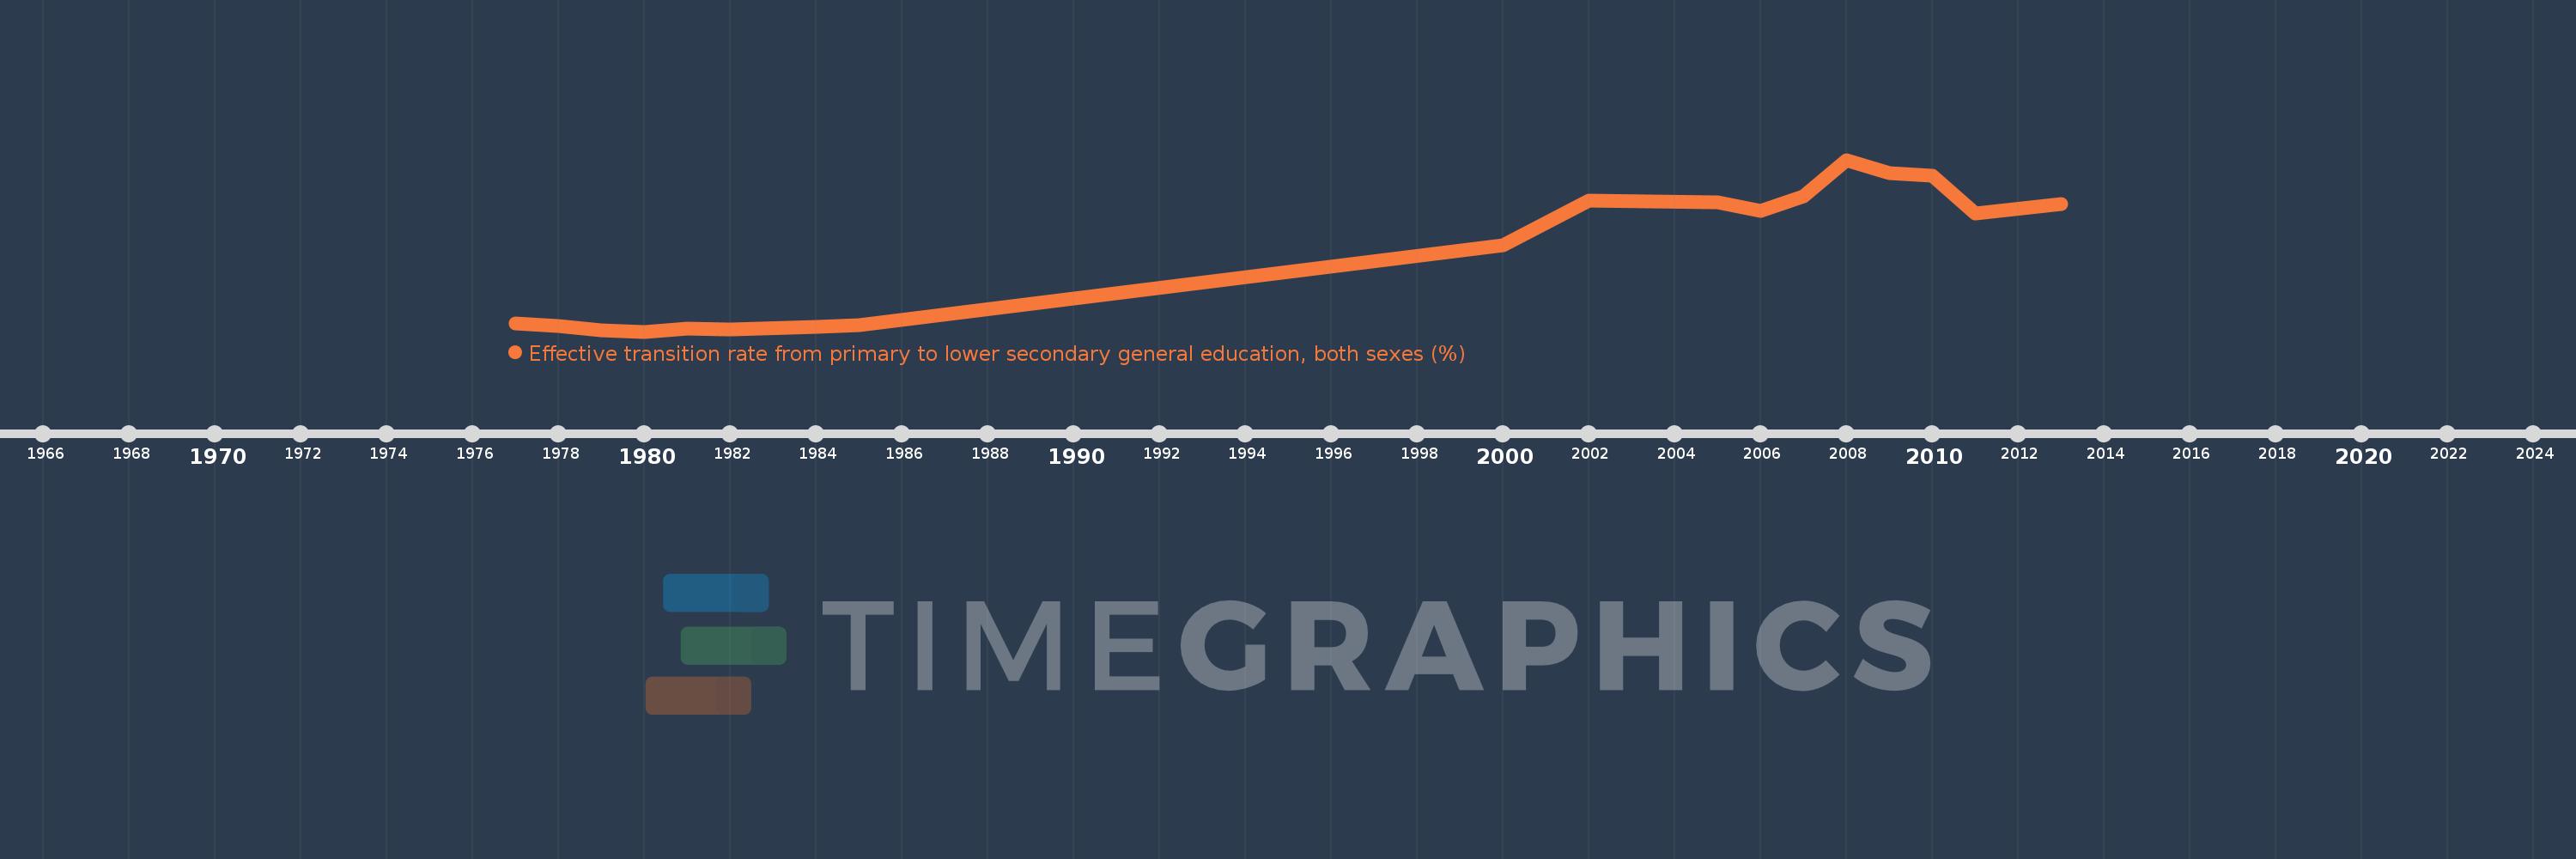
Effective transition rate from primary to lower secondary general education, both sexes (%)
2013,2011,2010,2009,2008,2007,2006,2005,2002,2000,1985,1984,1982,1981,1980,1979,1978,1977