33
/pt/
AIzaSyB4mHJ5NPEv-XzF7P6NDYXjlkCWaeKw5bc
November 1, 2025
164709
Jordan
JOR
true
2
1
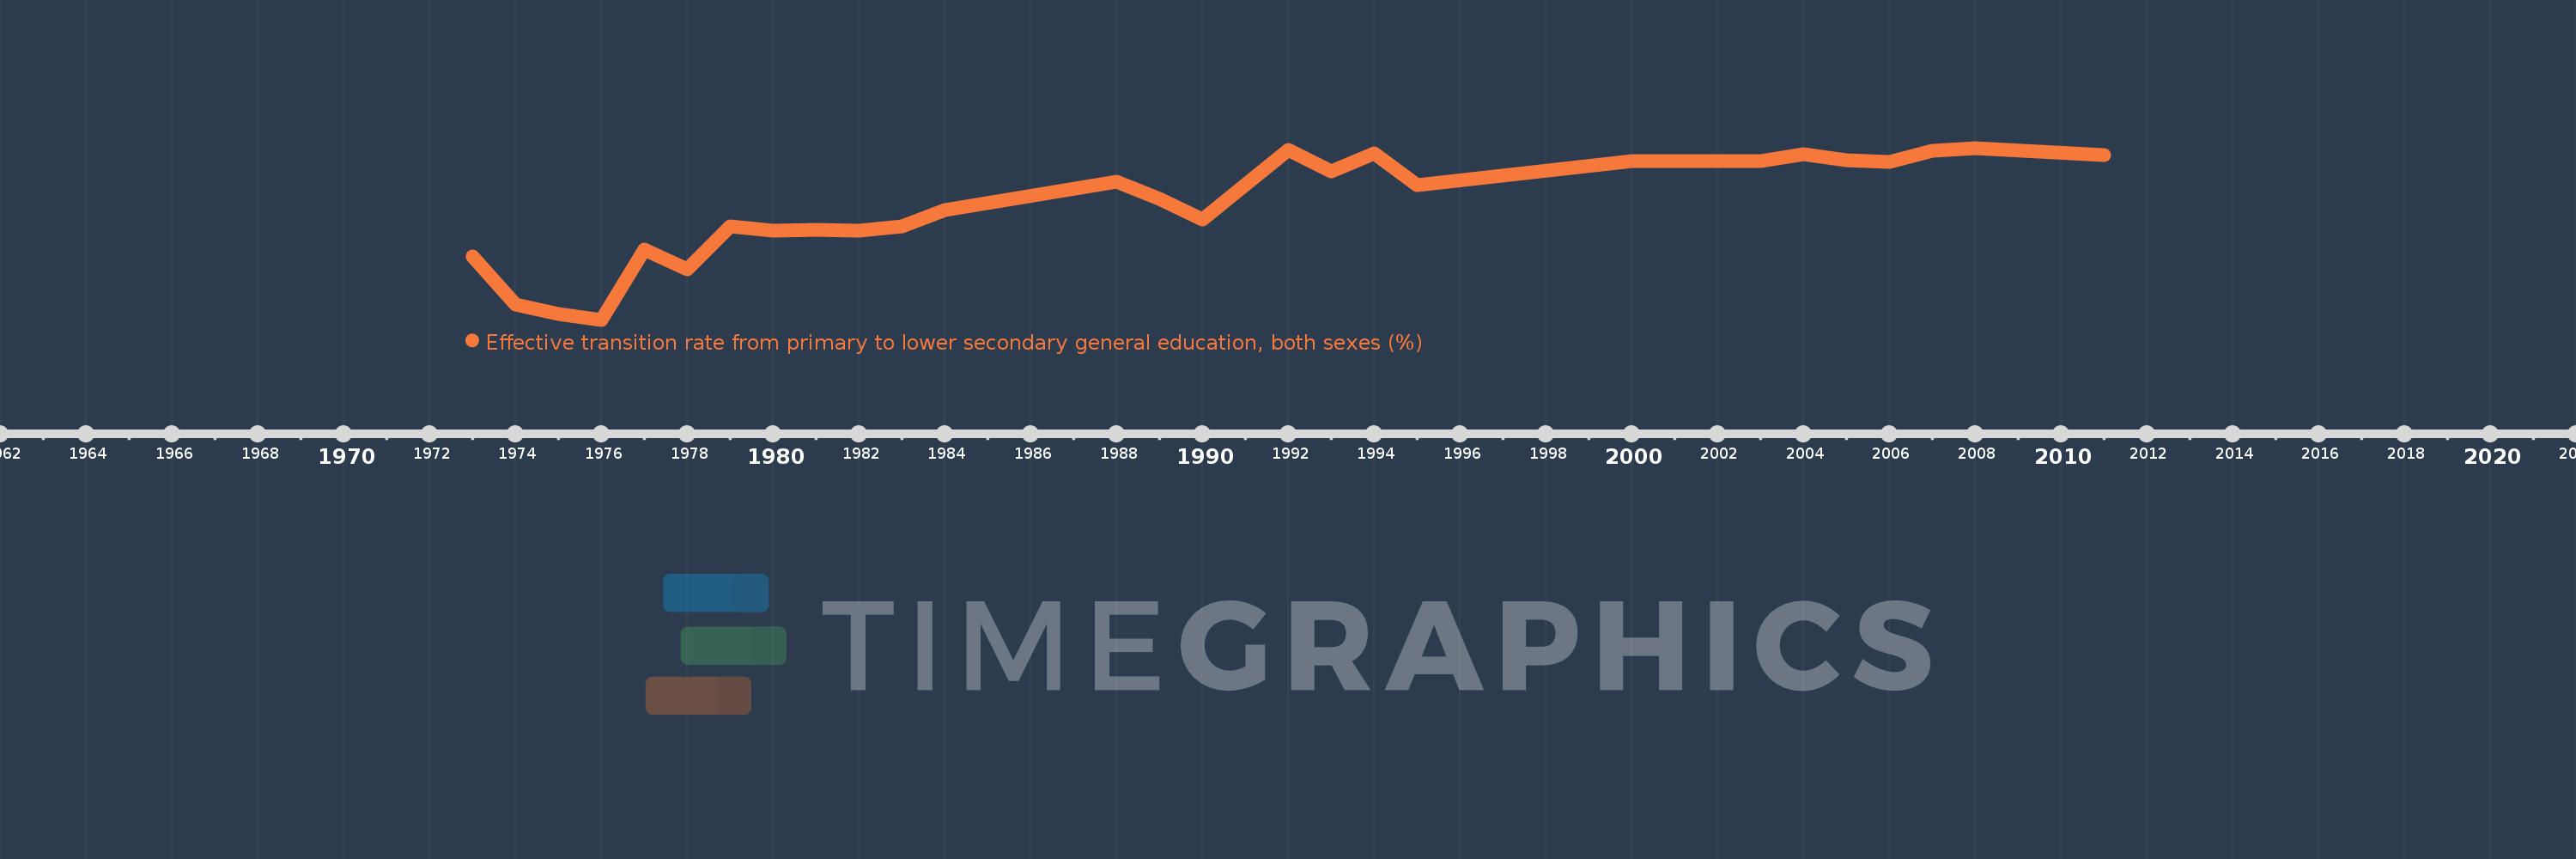
Effective transition rate from primary to lower secondary general education, both sexes (%)
2011,2008,2007,2006,2005,2004,2003,2000,1995,1994,1993,1992,1990,1989,1988,1984,1983,1982,1981,1980,1979,1978,1977,1976,1975,1974,1973