29
/pt/
pt
AIzaSyAYiBZKx7MnpbEhh9jyipgxe19OcubqV5w
April 1, 2024
283970
West Bank and Gaza
PSE
true
2
1
Percentage of repeaters in primary education, all grades, male (%)
2015,2014,2013,2012,2011,2010,2009,2008,2006,2005,2004,2003,2002,2001,2000,1998,1997,1996
Download
Biblioteca de estatísticas globais →West Bank and Gaza →

Percentage of repeaters in primary education, all grades, male (%)

Estas estatísticas em outros países:
AfghanistanAlbaniaAlgeriaAndorraAngolaAntigua and BarbudaArab WorldArgentinaArmeniaArubaAustriaAzerbaijanBahamas, TheBahrainBangladeshBelarusBelgiumBelizeBeninBermudaBhutanBoliviaBosnia and HerzegovinaBotswanaBrazilBritish Virgin IslandsBrunei DarussalamBulgariaBurkina FasoBurundiCabo VerdeCambodiaCameroonCanadaCaribbean small statesCayman IslandsCentral African RepublicCentral Europe and the BalticsChadChileChinaColombiaComorosCongo, Dem. Rep.Congo, Rep.Costa RicaCote d'IvoireCroatiaCubaCyprusCzech RepublicDenmarkDjiboutiDominicaDominican RepublicEarly-demographic dividendEast Asia & PacificEast Asia & Pacific (excluding high income)East Asia & Pacific (IDA & IBRD countries)EcuadorEgypt, Arab Rep.El SalvadorEquatorial GuineaEritreaEstoniaEthiopiaEuro areaEurope & Central AsiaEurope & Central Asia (excluding high income)Europe & Central Asia (IDA & IBRD countries)European UnionFijiFinlandFragile and conflict affected situationsFranceGabonGambia, TheGeorgiaGermanyGhanaGreeceGrenadaGuatemalaGuineaGuinea-BissauGuyanaHaitiHeavily indebted poor countries (HIPC)High incomeHondurasHong Kong SAR, ChinaHungaryIBRD onlyIcelandIDA & IBRD totalIDA blendIDA onlyIDA totalIndiaIndonesiaIran, Islamic Rep.IraqIrelandIsraelItalyJamaicaJapanJordanKazakhstanKenyaKiribatiKorea, Rep.KuwaitKyrgyz RepublicLao PDRLate-demographic dividendLatin America & Caribbean Latin America & Caribbean (excluding high income)Latin America & the Caribbean (IDA & IBRD countries)LatviaLeast developed countries: UN classificationLebanonLesothoLiberiaLibyaLiechtensteinLithuaniaLow & middle incomeLow incomeLower middle incomeLuxembourgMacao SAR, ChinaMacedonia, FYRMadagascarMalawiMalaysiaMaldivesMaliMaltaMauritaniaMauritiusMexicoMiddle East & North AfricaMiddle East & North Africa (excluding high income)Middle East & North Africa (IDA & IBRD countries)Middle incomeMoldovaMonacoMongoliaMontenegroMoroccoMozambiqueMyanmarNamibiaNauruNepalNetherlandsNew ZealandNicaraguaNigerNorwayOECD membersOmanOther small statesPacific island small statesPakistanPalauPanamaPapua New GuineaParaguayPeruPhilippinesPolandPortugalPost-demographic dividendPre-demographic dividendQatarRomaniaRussian FederationRwandaSamoaSan MarinoSao Tome and PrincipeSaudi ArabiaSenegalSerbiaSeychellesSierra LeoneSingaporeSint Maarten (Dutch part)Slovak RepublicSloveniaSmall statesSolomon IslandsSomaliaSouth AfricaSouth AsiaSouth Asia (IDA & IBRD)South SudanSpainSri LankaSt. Kitts and NevisSt. LuciaSt. Vincent and the GrenadinesSub-Saharan Africa Sub-Saharan Africa (excluding high income)Sub-Saharan Africa (IDA & IBRD countries)SudanSurinameSwazilandSwedenSwitzerlandSyrian Arab RepublicTajikistanTanzaniaThailandTimor-LesteTogoTongaTrinidad and TobagoTunisiaTurkeyTurks and Caicos IslandsTuvaluUgandaUkraineUnited Arab EmiratesUnited KingdomUpper middle incomeUruguayUzbekistanVanuatuVenezuela, RBVietnamWest Bank and GazaWorldYemen, Rep.ZambiaZimbabwe
Linha do tempo:
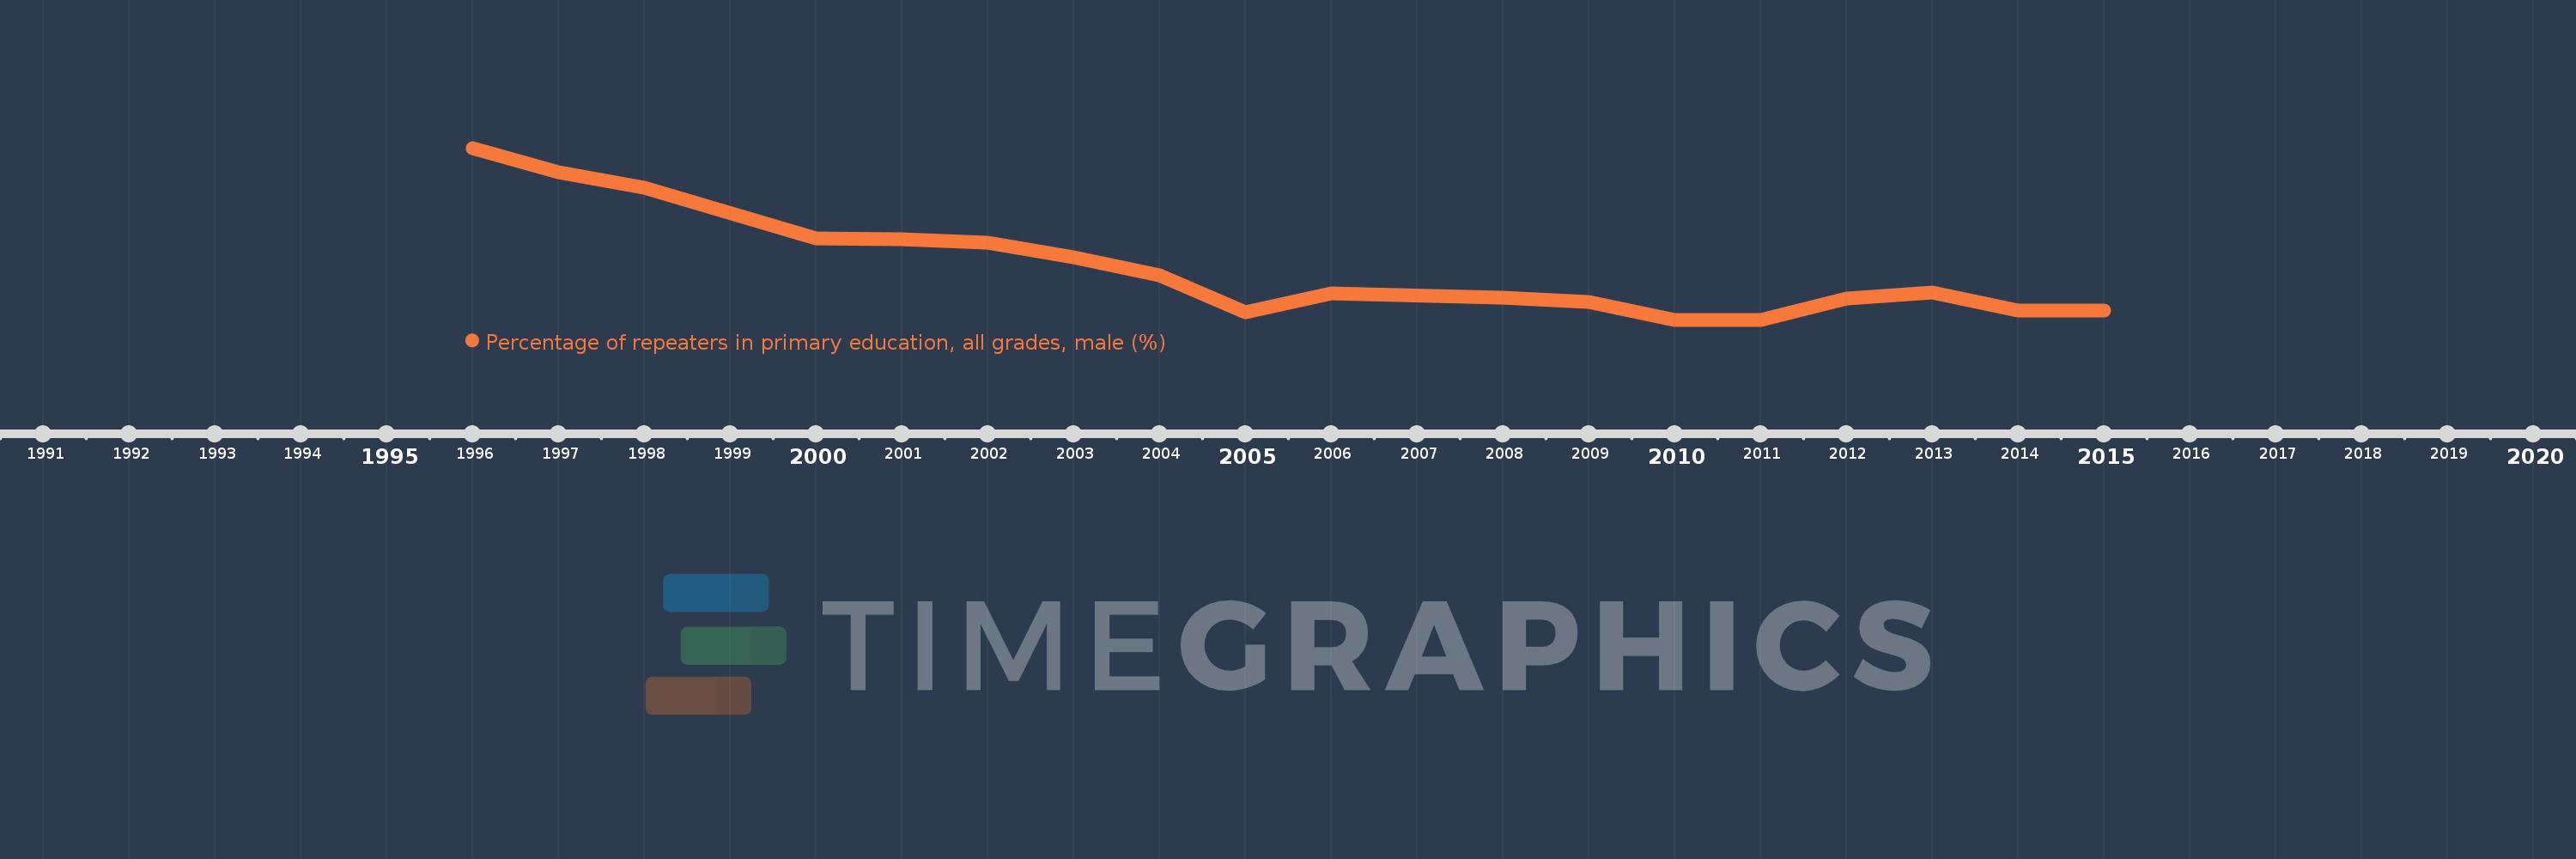
Nesta escala de tempo está apresentado um gráfico de 1996 ano até 2015 ano West Bank and Gaza. Dados de 1995 ano ausente. O número de observações reais por data: 18.
Fonte (nome):
Indicadores de desenvolvimento mundial
Fonte (organização):
UNESCO Institute for Statistics
Categorias:
Education, Gender
Foi atualizado:
23 abr 2017 ano
Indicadores de alterações dos valores ao longo dos anos
Em média:
1.401
Mínimo:
0.0
1 jan 2010 ano
Máximo:
4.628
1 jan 1996 ano
Na data de observação
Valor
Mudança absoluta
A alteração em relação ao valor anterior
1 jan 1996 ano
4.628
+4.628
0.0%
1 jan 1997 ano
3.974
-0.654
-14.14%
1 jan 1998 ano
3.559
-0.414
-10.43%
1 jan 2000 ano
2.182
-1.377
-38.7%
1 jan 2001 ano
2.16
-0.022
-1.01%
1 jan 2002 ano
2.067
-0.093
-4.32%
1 jan 2003 ano
1.685
-0.382
-18.47%
1 jan 2004 ano
1.199
-0.485
-28.81%
1 jan 2005 ano
0.19
-1.01
-84.17%
1 jan 2006 ano
0.713
+0.524
275.74%
1 jan 2008 ano
0.586
-0.127
-17.8%
1 jan 2009 ano
0.473
-0.113
-19.34%
1 jan 2010 ano
0.0
-0.473
-100.0%
1 jan 2011 ano
0.0
0.0
%
1 jan 2012 ano
0.577
+0.577
%
1 jan 2013 ano
0.722
+0.145
25.11%
1 jan 2014 ano
0.255
-0.467
-64.7%
1 jan 2015 ano
0.252
-0.003
-1.04%
Classificação de países por estatísticas atuais por anos

Comentários:

Enviar
PremiumAbout & FeedbackAcordoPrivacidade
logo
© 2022 Selected Technologies LLC – Morgan Hill, California