33
/pt/
AIzaSyAYiBZKx7MnpbEhh9jyipgxe19OcubqV5w
August 1, 2025
274314
Ukraine
UKR
true
2
1
Short-term debt (% of total reserves)
2016,2015,2014,2013,2012,2011,2010,2009,2008,2007,2006,2005,2004,2003,2002,2001,2000,1999,1998,1997,1996,1995,1994,1993
Download
Biblioteca de estatísticas globais →Ukraine →

Short-term debt (% of total reserves)

Estas estatísticas em outros países:

AfghanistanAlbaniaAlgeriaAngolaArgentinaArmeniaAzerbaijanBangladeshBelarusBelizeBeninBhutanBoliviaBosnia and HerzegovinaBotswanaBrazilBulgariaBurkina FasoBurundiCabo VerdeCambodiaCameroonCentral African RepublicCentral Europe and the BalticsChadChinaColombiaComorosCongo, Dem. Rep.Congo, Rep.Costa RicaCote d'IvoireDjiboutiDominicaDominican RepublicEarly-demographic dividendEast Asia & Pacific (excluding high income)East Asia & Pacific (IDA & IBRD countries)EcuadorEgypt, Arab Rep.El SalvadorEritreaEthiopiaEurope & Central Asia (excluding high income)Europe & Central Asia (IDA & IBRD countries)FijiFragile and conflict affected situationsGabonGambia, TheGeorgiaGhanaGrenadaGuatemalaGuineaGuinea-BissauGuyanaHaitiHeavily indebted poor countries (HIPC)HondurasIBRD onlyIDA & IBRD totalIDA blendIDA onlyIDA totalIndiaIndonesiaIran, Islamic Rep.JamaicaJordanKazakhstanKenyaKosovoKyrgyz RepublicLao PDRLate-demographic dividendLatin America & Caribbean Latin America & Caribbean (excluding high income)Latin America & the Caribbean (IDA & IBRD countries)Least developed countries: UN classificationLebanonLesothoLiberiaLow & middle incomeLow incomeLower middle incomeMacedonia, FYRMadagascarMalawiMalaysiaMaldivesMaliMauritaniaMauritiusMexicoMiddle East & North Africa (excluding high income)Middle East & North Africa (IDA & IBRD countries)Middle incomeMoldovaMongoliaMontenegroMoroccoMozambiqueMyanmarNepalNicaraguaNigerNigeriaPacific island small statesPakistanPanamaPapua New GuineaParaguayPeruPhilippinesPre-demographic dividendRomaniaRussian FederationRwandaSamoaSao Tome and PrincipeSenegalSerbiaSierra LeoneSolomon IslandsSouth AfricaSouth AsiaSouth Asia (IDA & IBRD)Sri LankaSt. LuciaSt. Vincent and the GrenadinesSub-Saharan Africa Sub-Saharan Africa (excluding high income)Sub-Saharan Africa (IDA & IBRD countries)SudanSwazilandSyrian Arab RepublicTajikistanTanzaniaThailandTogoTongaTunisiaTurkeyUgandaUkraineUpper middle incomeVanuatuVenezuela, RBVietnamYemen, Rep.ZambiaZimbabwe

Linha do tempo:

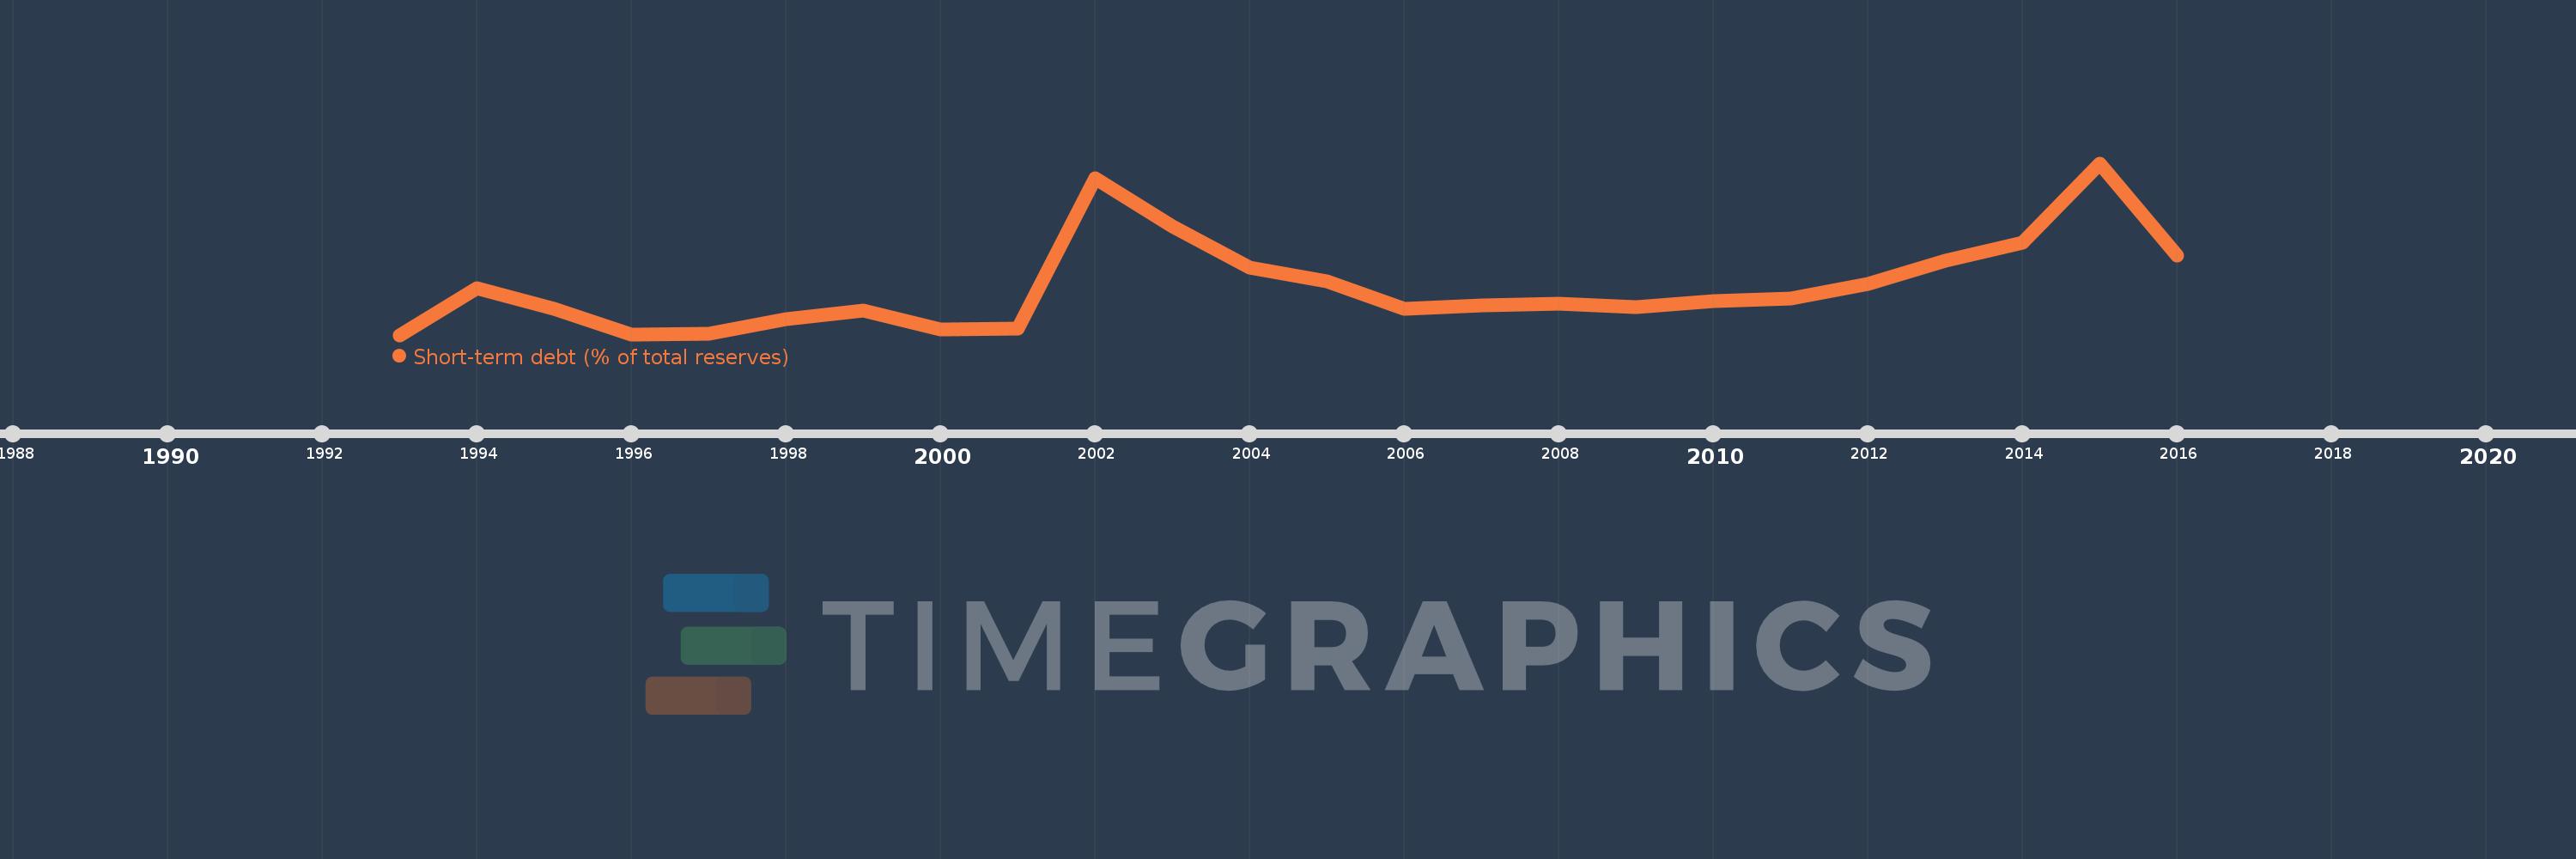
Nesta escala de tempo está apresentado um gráfico de 1993 ano até 2016 ano Ukraine. Dados de 1992 ano ausente. O número de observações reais por data: 24.

Fonte (nome):

Indicadores de desenvolvimento mundial

Fonte (organização):

World Bank, International Debt Statistics.

Categorias:

Economy & Growth, External Debt

Foi atualizado:

23 abr 2017 ano

Indicadores de alterações dos valores ao longo dos anos

Em média:
99.457
Mínimo:
19.822
1 jan 1993 ano
Máximo:
300.968
1 jan 2015 ano
Na data de observação
Valor
Mudança absoluta
A alteração em relação ao valor anterior
1 jan 1993 ano
19.822
+19.822
0.0%
1 jan 1994 ano
96.812
+76.99
388.4%
1 jan 1995 ano
62.788
-34.024
-35.14%
1 jan 1996 ano
20.899
-41.889
-66.72%
1 jan 1997 ano
22.51
+1.611
7.71%
1 jan 1998 ano
46.166
+23.656
105.09%
1 jan 1999 ano
60.455
+14.289
30.95%
1 jan 2000 ano
28.84
-31.615
-52.29%
1 jan 2001 ano
30.269
+1.429
4.95%
1 jan 2002 ano
277.012
+246.743
815.17%
1 jan 2003 ano
197.525
-79.488
-28.69%
1 jan 2004 ano
129.786
-67.739
-34.29%
1 jan 2005 ano
107.425
-22.361
-17.23%
1 jan 2006 ano
62.218
-45.206
-42.08%
1 jan 2007 ano
68.698
+6.48
10.41%
1 jan 2008 ano
70.539
+1.841
2.68%
1 jan 2009 ano
65.42
-5.119
-7.26%
1 jan 2010 ano
74.991
+9.571
14.63%
1 jan 2011 ano
78.863
+3.871
5.16%
1 jan 2012 ano
102.95
+24.088
30.54%
1 jan 2013 ano
141.534
+38.584
37.48%
1 jan 2014 ano
170.588
+29.054
20.53%
1 jan 2015 ano
300.968
+130.38
76.43%
1 jan 2016 ano
149.9
-151.067
-50.19%

Classificação de países por estatísticas atuais por anos