29
/pt/
pt
AIzaSyAYiBZKx7MnpbEhh9jyipgxe19OcubqV5w
April 1, 2024
198292
Moldova
MDA
true
2
1
Short-term debt (% of total reserves)
2016,2015,2014,2013,2012,2011,2010,2009,2008,2007,2006,2005,2004,2003,2002,2001,2000,1999,1998,1997,1996,1995,1994,1993
Download
Biblioteca de estatísticas globais →Moldova →

Short-term debt (% of total reserves)

Estas estatísticas em outros países:
AfghanistanAlbaniaAlgeriaAngolaArgentinaArmeniaAzerbaijanBangladeshBelarusBelizeBeninBhutanBoliviaBosnia and HerzegovinaBotswanaBrazilBulgariaBurkina FasoBurundiCabo VerdeCambodiaCameroonCentral African RepublicCentral Europe and the BalticsChadChinaColombiaComorosCongo, Dem. Rep.Congo, Rep.Costa RicaCote d'IvoireDjiboutiDominicaDominican RepublicEarly-demographic dividendEast Asia & Pacific (excluding high income)East Asia & Pacific (IDA & IBRD countries)EcuadorEgypt, Arab Rep.El SalvadorEritreaEthiopiaEurope & Central Asia (excluding high income)Europe & Central Asia (IDA & IBRD countries)FijiFragile and conflict affected situationsGabonGambia, TheGeorgiaGhanaGrenadaGuatemalaGuineaGuinea-BissauGuyanaHaitiHeavily indebted poor countries (HIPC)HondurasIBRD onlyIDA & IBRD totalIDA blendIDA onlyIDA totalIndiaIndonesiaIran, Islamic Rep.JamaicaJordanKazakhstanKenyaKosovoKyrgyz RepublicLao PDRLate-demographic dividendLatin America & Caribbean Latin America & Caribbean (excluding high income)Latin America & the Caribbean (IDA & IBRD countries)Least developed countries: UN classificationLebanonLesothoLiberiaLow & middle incomeLow incomeLower middle incomeMacedonia, FYRMadagascarMalawiMalaysiaMaldivesMaliMauritaniaMauritiusMexicoMiddle East & North Africa (excluding high income)Middle East & North Africa (IDA & IBRD countries)Middle incomeMoldovaMongoliaMontenegroMoroccoMozambiqueMyanmarNepalNicaraguaNigerNigeriaPacific island small statesPakistanPanamaPapua New GuineaParaguayPeruPhilippinesPre-demographic dividendRomaniaRussian FederationRwandaSamoaSao Tome and PrincipeSenegalSerbiaSierra LeoneSolomon IslandsSouth AfricaSouth AsiaSouth Asia (IDA & IBRD)Sri LankaSt. LuciaSt. Vincent and the GrenadinesSub-Saharan Africa Sub-Saharan Africa (excluding high income)Sub-Saharan Africa (IDA & IBRD countries)SudanSwazilandSyrian Arab RepublicTajikistanTanzaniaThailandTogoTongaTunisiaTurkeyUgandaUkraineUpper middle incomeVanuatuVenezuela, RBVietnamYemen, Rep.ZambiaZimbabwe
Linha do tempo:
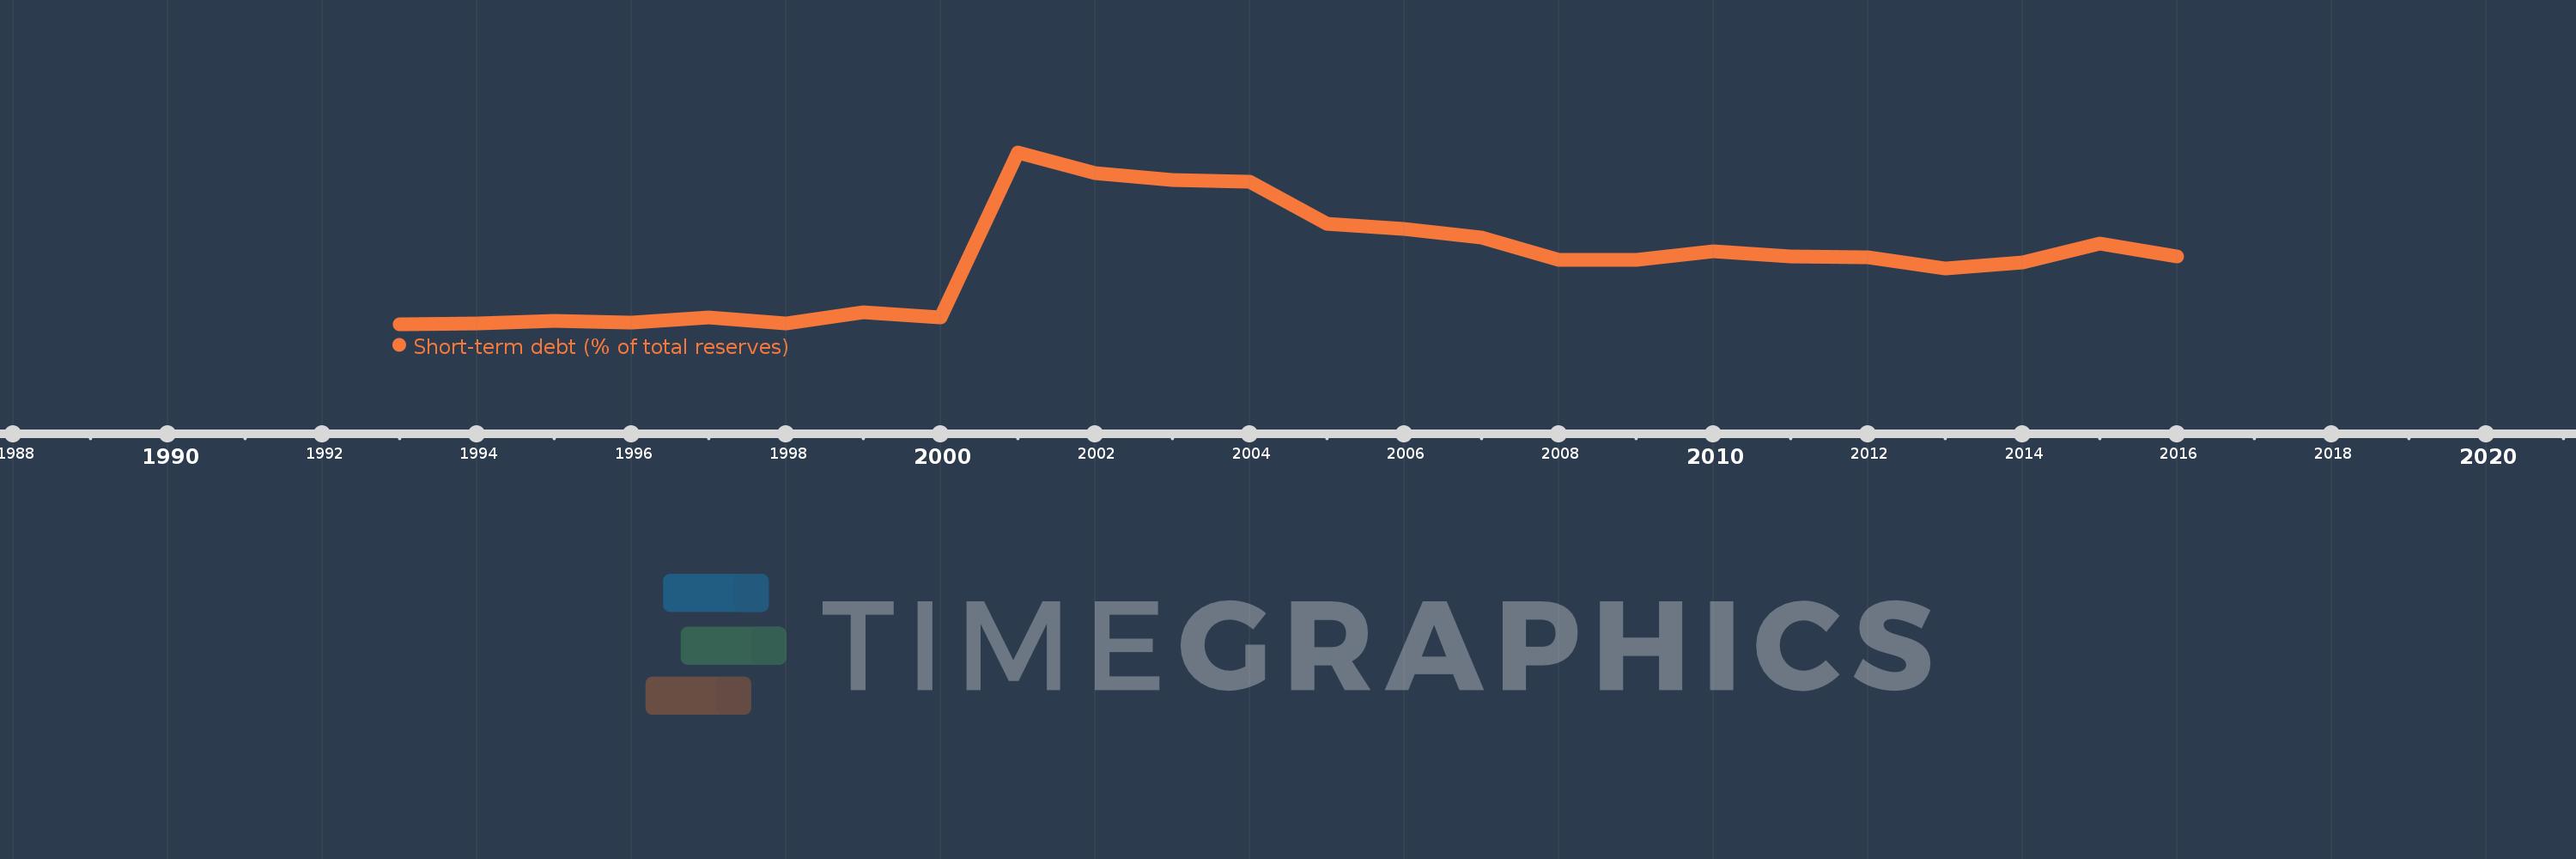
Nesta escala de tempo está apresentado um gráfico de 1993 ano até 2016 ano Moldova. Dados de 1992 ano ausente. O número de observações reais por data: 24.
Fonte (nome):
Indicadores de desenvolvimento mundial
Fonte (organização):
World Bank, International Debt Statistics.
Categorias:
Economy & Growth, External Debt
Foi atualizado:
23 abr 2017 ano
Indicadores de alterações dos valores ao longo dos anos
Em média:
80.081
Mínimo:
0.0
1 jan 1993 ano
Máximo:
216.131
1 jan 2001 ano
Na data de observação
Valor
Mudança absoluta
A alteração em relação ao valor anterior
1 jan 1993 ano
0.0
0.0
0.0%
1 jan 1994 ano
1.137
+1.137
%
1 jan 1995 ano
4.475
+3.338
293.53%
1 jan 1996 ano
2.32
-2.155
-48.15%
1 jan 1997 ano
8.588
+6.268
270.13%
1 jan 1998 ano
1.095
-7.493
-87.25%
1 jan 1999 ano
14.674
+13.579
1.24 mil%
1 jan 2000 ano
8.641
-6.033
-41.11%
1 jan 2001 ano
216.131
+207.49
2.4 mil%
1 jan 2002 ano
190.58
-25.552
-11.82%
1 jan 2003 ano
181.732
-8.848
-4.64%
1 jan 2004 ano
178.926
-2.806
-1.54%
1 jan 2005 ano
125.927
-52.999
-29.62%
1 jan 2006 ano
120.107
-5.819
-4.62%
1 jan 2007 ano
108.596
-11.512
-9.58%
1 jan 2008 ano
80.901
-27.695
-25.5%
1 jan 2009 ano
81.196
+0.295
0.36%
1 jan 2010 ano
92.253
+11.057
13.62%
1 jan 2011 ano
85.629
-6.624
-7.18%
1 jan 2012 ano
84.231
-1.398
-1.63%
1 jan 2013 ano
70.068
-14.163
-16.81%
1 jan 2014 ano
77.435
+7.367
10.51%
1 jan 2015 ano
101.681
+24.246
31.31%
1 jan 2016 ano
85.616
-16.065
-15.8%
Classificação de países por estatísticas atuais por anos

Comentários:

Enviar
PremiumAbout & FeedbackAcordoPrivacidade
logo
© 2022 Selected Technologies LLC – Morgan Hill, California