33
/pt/
AIzaSyB4mHJ5NPEv-XzF7P6NDYXjlkCWaeKw5bc
November 1, 2025
269592
Turkey
TUR
true
2
1
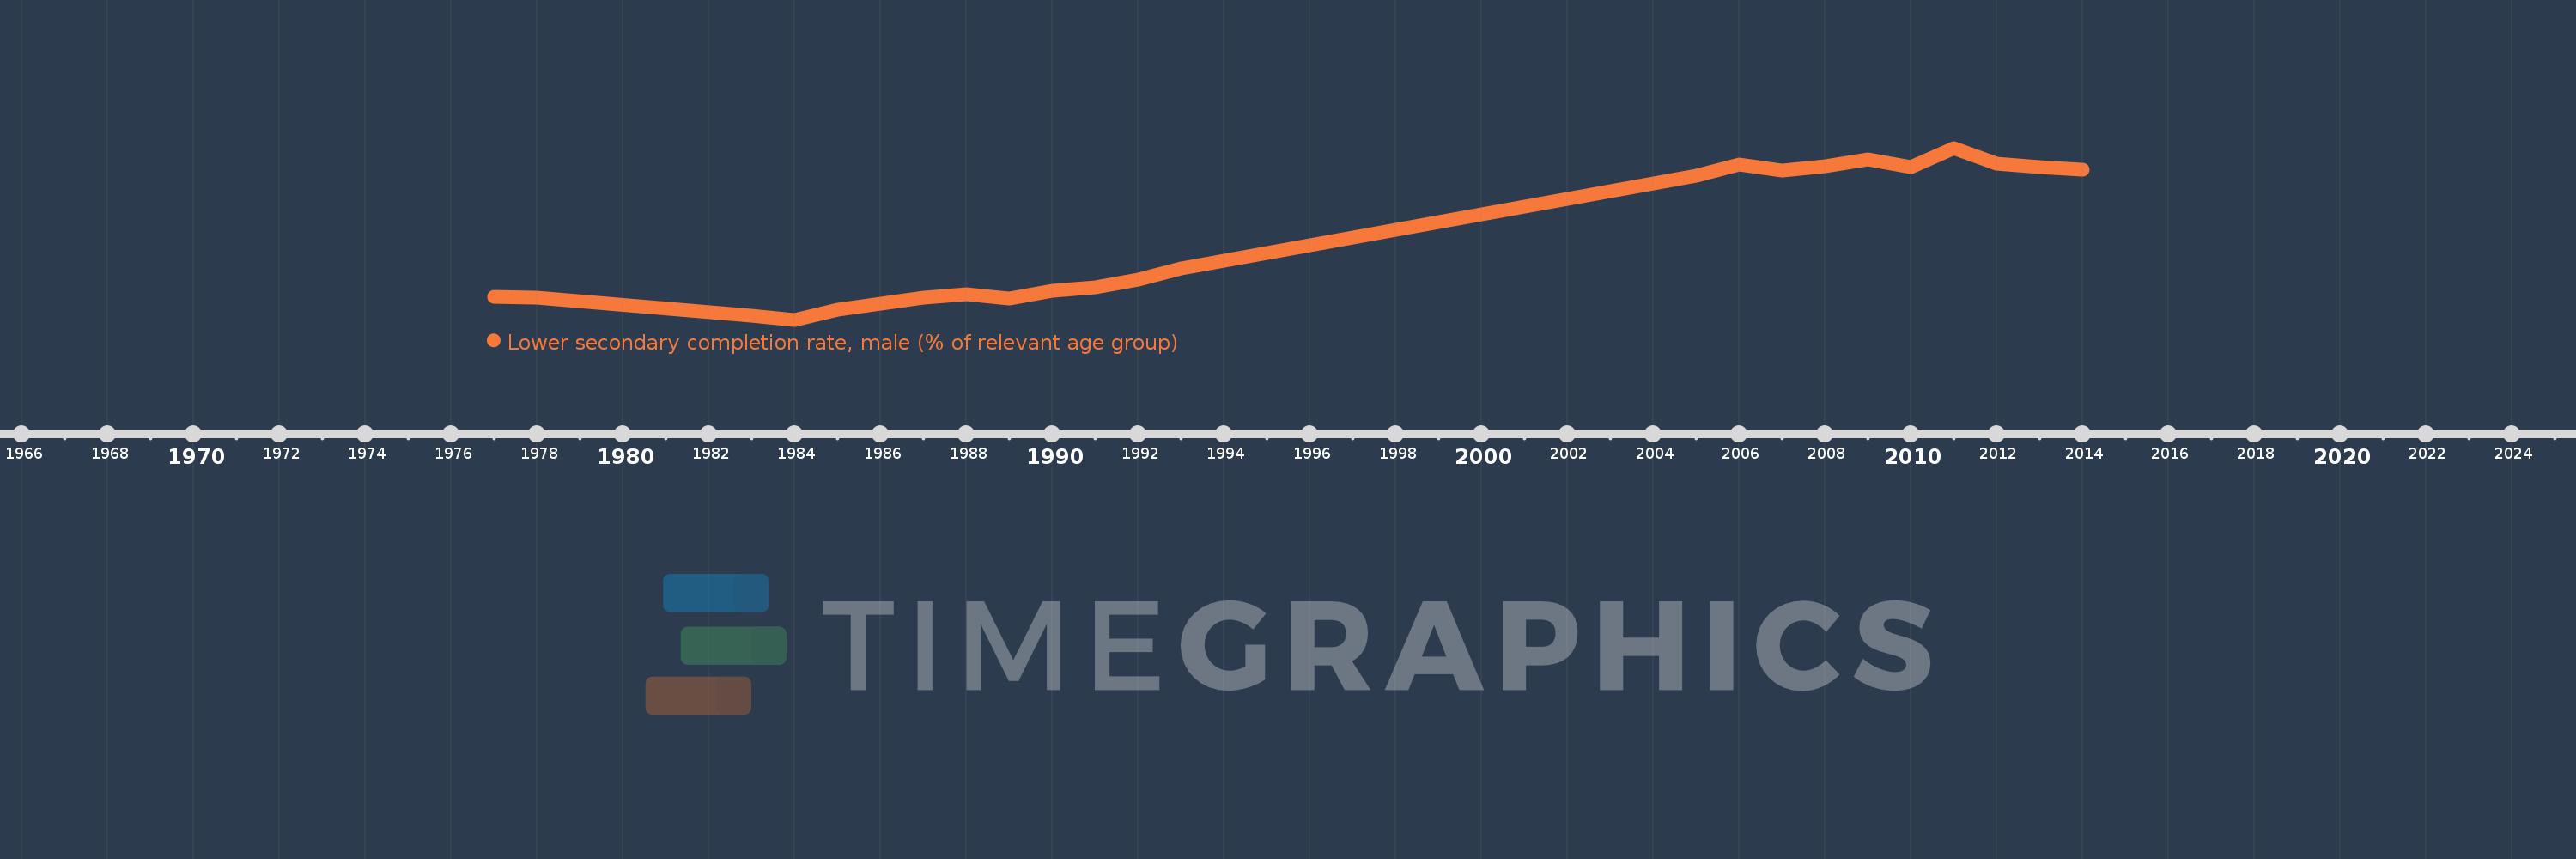
Lower secondary completion rate, male (% of relevant age group)
2014,2013,2012,2011,2010,2009,2008,2007,2006,2005,1993,1992,1991,1990,1989,1988,1987,1985,1984,1983,1978,1977