33
/pt/
AIzaSyB4mHJ5NPEv-XzF7P6NDYXjlkCWaeKw5bc
November 1, 2025
111183
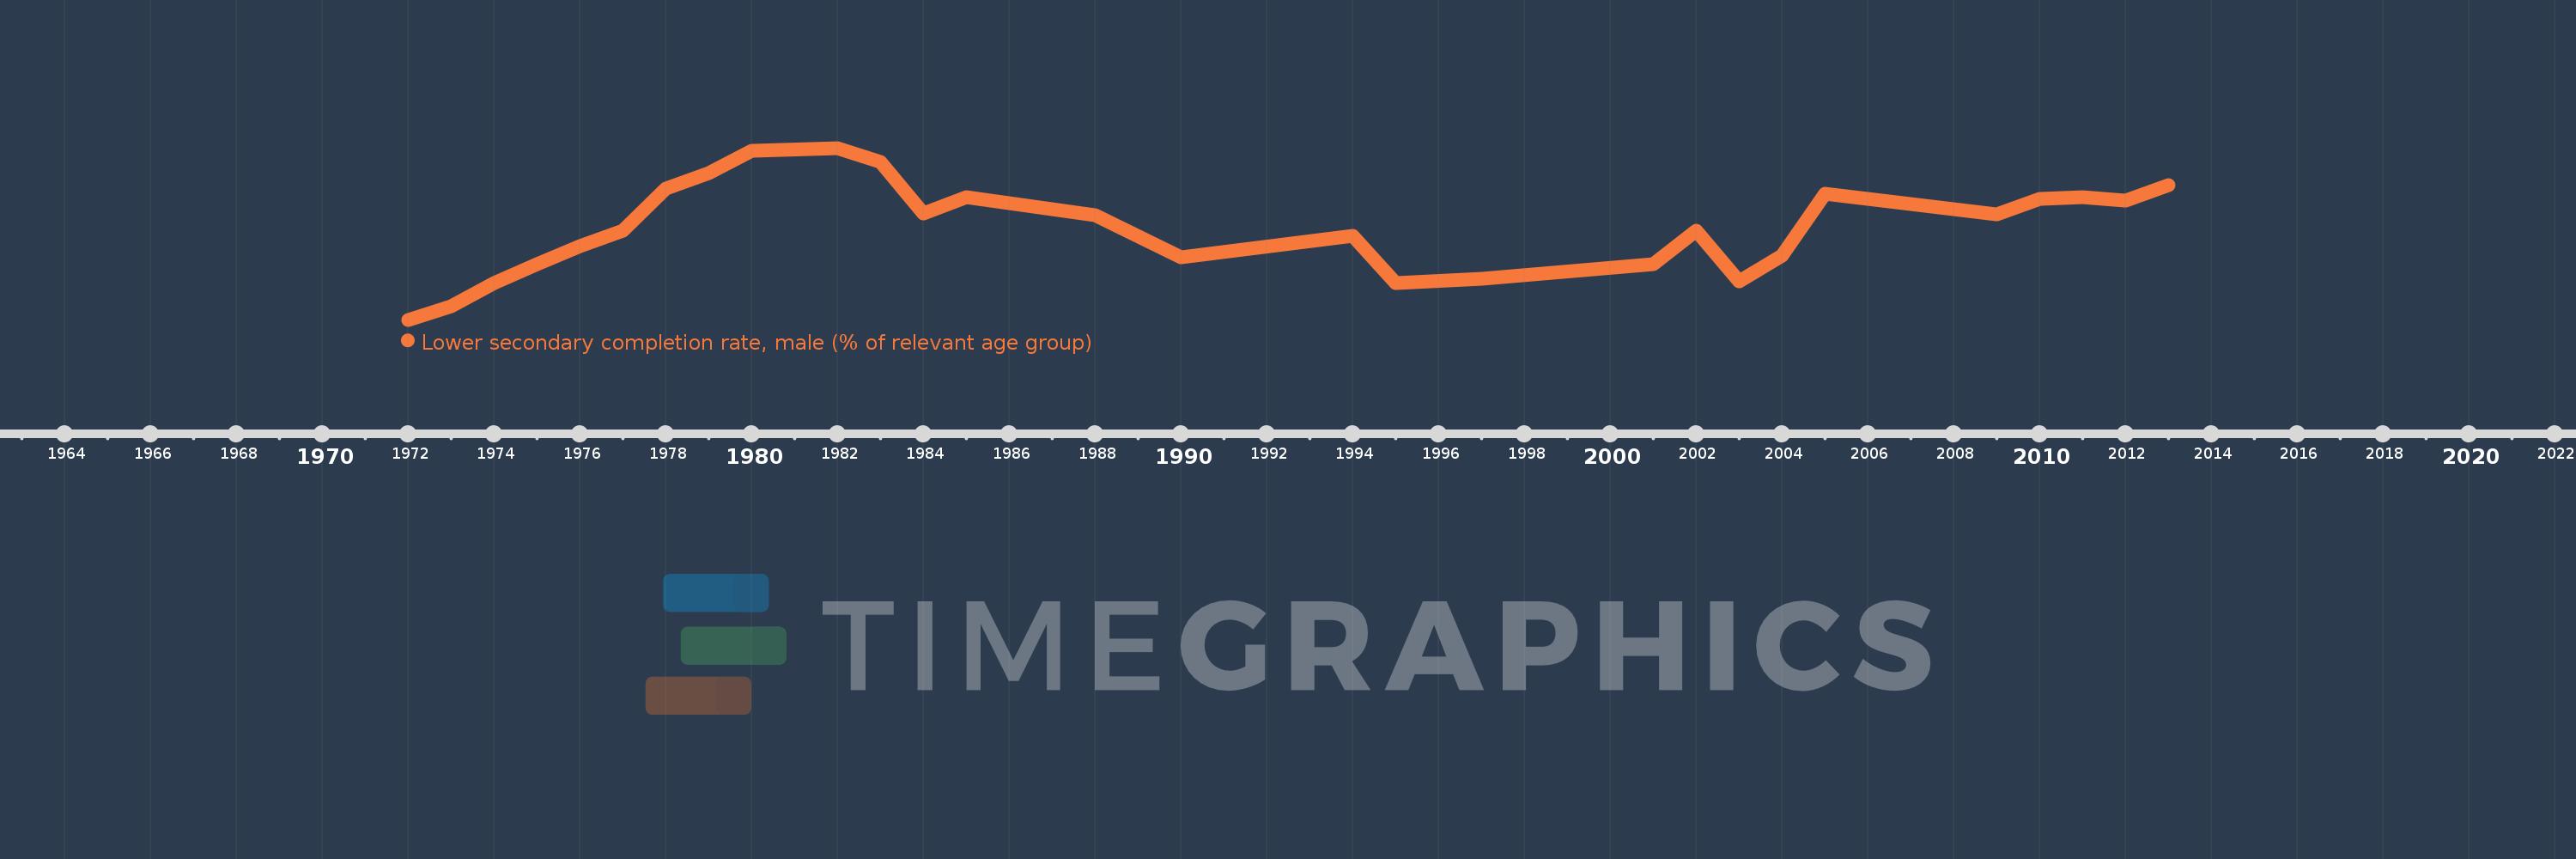
Congo, Rep.
COG
true
2
1
Lower secondary completion rate, male (% of relevant age group)
2013,2012,2011,2010,2009,2005,2004,2003,2002,2001,1997,1995,1994,1990,1988,1985,1984,1983,1982,1980,1979,1978,1977,1976,1975,1974,1973,1972