33
/pt/
AIzaSyB4mHJ5NPEv-XzF7P6NDYXjlkCWaeKw5bc
November 30, 2025
264975
Togo
TGO
true
2
1
Net incurrence of liabilities, total (% of GDP)
2014,2013,2012,2011,2010,2009,2008,2007
Create a timeline
Public Timelines
For education
For educational institutions
For teachers
For students
Cabinet
For educational institutions
For teachers
For students
Open cabinet
FAQ
Close
Create a timeline
Public timelines
FAQ
About & Feedback
Acordo
Privacidade
FAQ
Support 24/7
Cabinet
Get premium
Donate
Download
Biblioteca de estatísticas globais
→
Togo
→
Net incurrence of liabilities, total (% of GDP)
Estas estatísticas em outros países:
Afghanistan
Albania
Algeria
Angola
Antigua and Barbuda
Armenia
Australia
Austria
Azerbaijan
Bahamas, The
Bahrain
Bangladesh
Barbados
Belarus
Belgium
Belize
Benin
Bhutan
Bolivia
Bosnia and Herzegovina
Brazil
Burkina Faso
Burundi
Cabo Verde
Cambodia
Canada
Central African Republic
Central Europe and the Baltics
Chile
China
Colombia
Congo, Dem. Rep.
Congo, Rep.
Cote d'Ivoire
Croatia
Cyprus
Czech Republic
Dominica
Dominican Republic
East Asia & Pacific (excluding high income)
East Asia & Pacific (IDA & IBRD countries)
Egypt, Arab Rep.
El Salvador
Equatorial Guinea
Estonia
Ethiopia
Euro area
Europe & Central Asia
Europe & Central Asia (excluding high income)
Europe & Central Asia (IDA & IBRD countries)
European Union
Fiji
Finland
France
Georgia
Germany
Ghana
Greece
Guatemala
High income
Honduras
Hong Kong SAR, China
Hungary
IBRD only
Iceland
IDA & IBRD total
India
Indonesia
Iran, Islamic Rep.
Iraq
Ireland
Israel
Italy
Jamaica
Japan
Jordan
Kazakhstan
Kiribati
Korea, Rep.
Kyrgyz Republic
Lao PDR
Late-demographic dividend
Lebanon
Lesotho
Lithuania
Low & middle income
Low income
Lower middle income
Luxembourg
Macedonia, FYR
Madagascar
Malawi
Malaysia
Maldives
Mali
Malta
Mauritius
Micronesia, Fed. Sts.
Middle East & North Africa (excluding high income)
Middle East & North Africa (IDA & IBRD countries)
Middle income
Moldova
Mongolia
Morocco
Mozambique
Namibia
Nepal
Netherlands
New Zealand
Nigeria
North America
Norway
OECD members
Oman
Pacific island small states
Paraguay
Peru
Philippines
Poland
Portugal
Post-demographic dividend
Romania
Russian Federation
Rwanda
Samoa
San Marino
Sao Tome and Principe
Senegal
Serbia
Seychelles
Sierra Leone
Singapore
Slovak Republic
Solomon Islands
South Africa
South Asia
South Asia (IDA & IBRD)
Spain
Sri Lanka
St. Kitts and Nevis
Sub-Saharan Africa
Sub-Saharan Africa (excluding high income)
Sub-Saharan Africa (IDA & IBRD countries)
Suriname
Swaziland
Sweden
Switzerland
Syrian Arab Republic
Tanzania
Thailand
Togo
Trinidad and Tobago
Turkey
Uganda
Ukraine
United Arab Emirates
United Kingdom
United States
Upper middle income
Uruguay
Vanuatu
Vietnam
West Bank and Gaza
Zimbabwe
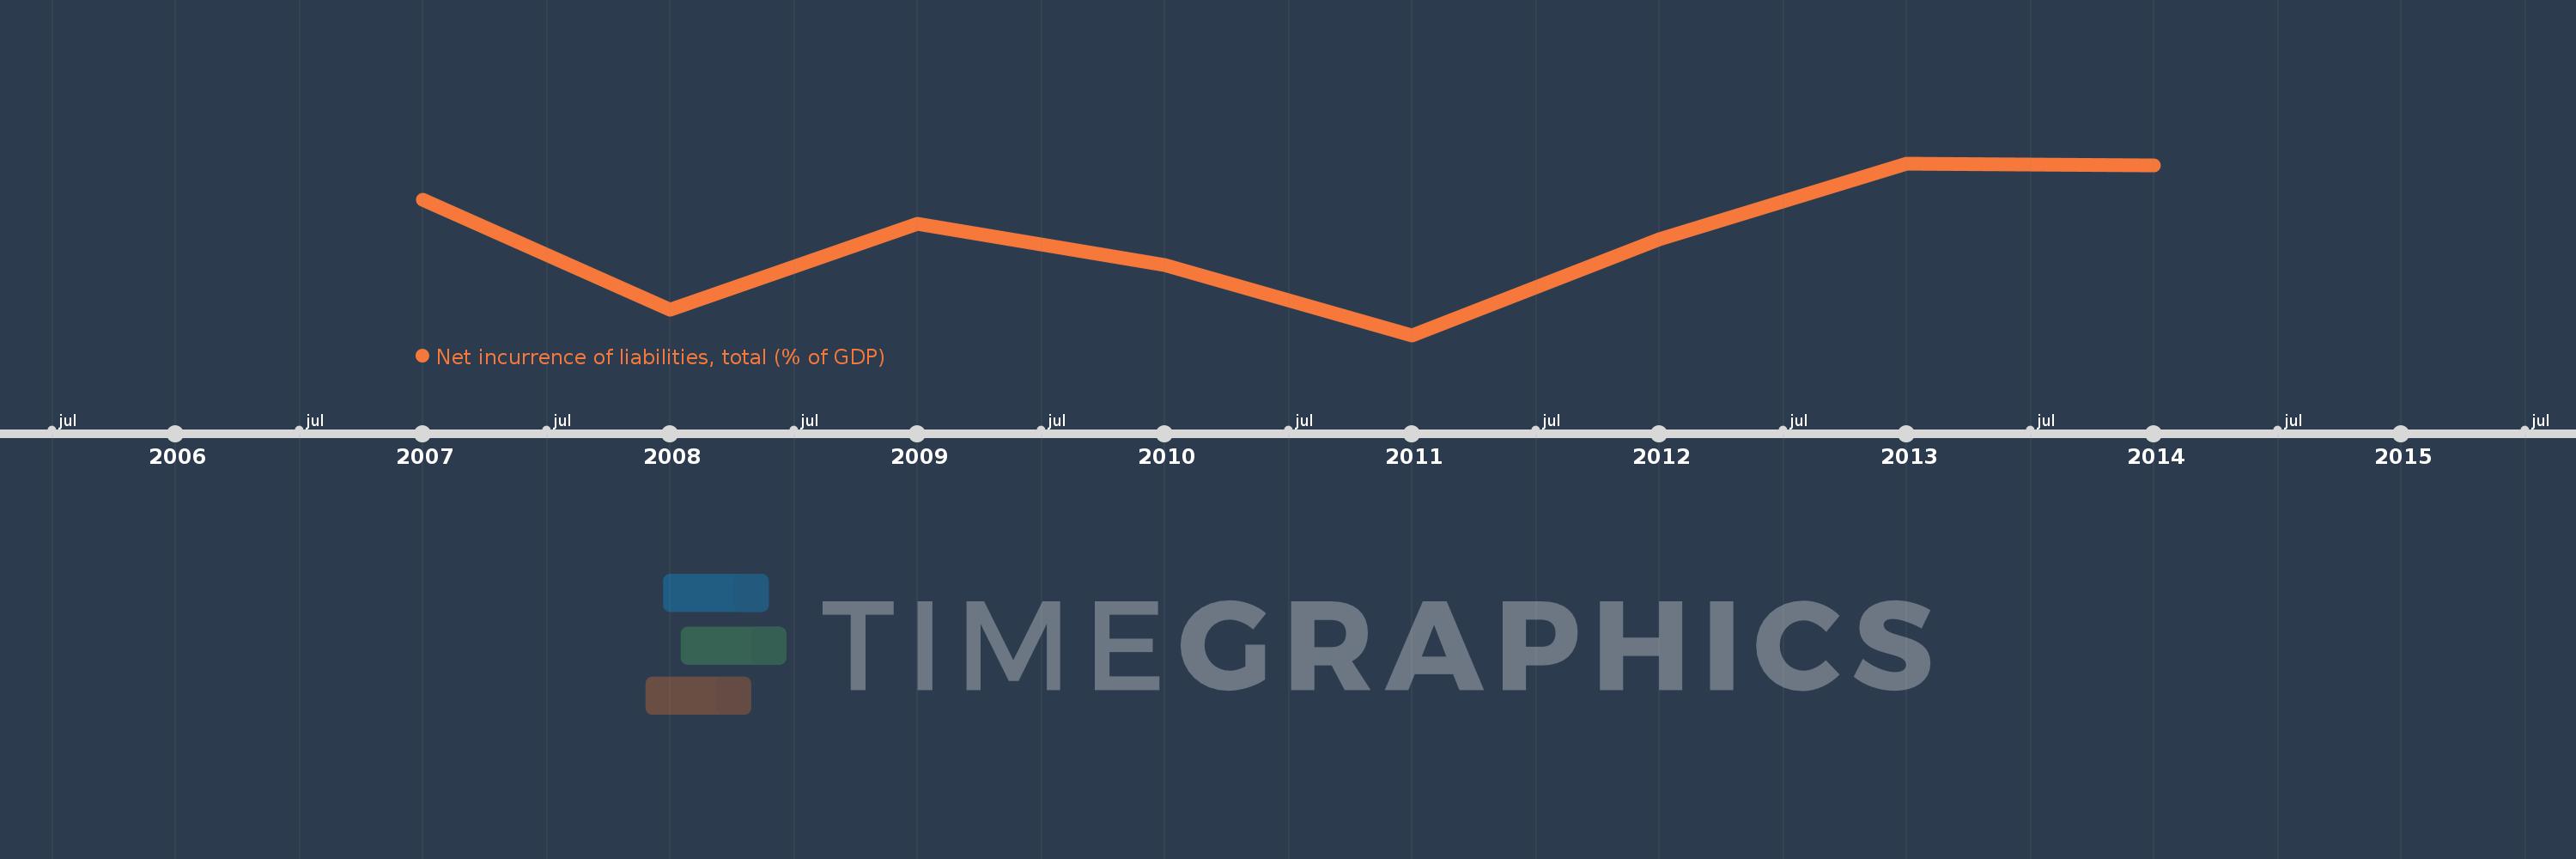
Linha do tempo:
Nesta escala de tempo está apresentado um gráfico de
2007
ano até
2014
ano Togo. Dados de
2006
ano ausente. O número de observações reais por data:
8
.
Fonte (nome):
Indicadores de desenvolvimento mundial
Fonte (organização):
International Monetary Fund, Government Finance Statistics Yearbook and data files.
Categorias:
Public Sector
Foi atualizado:
23 abr 2017 ano
Indicadores de alterações dos valores ao longo dos anos
Em média:
3.136
Mínimo:
-0.773
1 jan 2011 ano
Máximo:
6.125
1 jan 2013 ano
Na data de observação
Valor
Mudança absoluta
A alteração em relação ao valor anterior
1 jan 2007 ano
4.659
+4.659
0.0%
1 jan 2008 ano
0.253
-4.407
-94.58%
1 jan 2009 ano
3.678
+3.425
1.36 mil%
1 jan 2010 ano
2.036
-1.642
-44.64%
1 jan 2011 ano
-0.773
-2.809
-137.99%
1 jan 2012 ano
3.074
+3.848
-497.51%
1 jan 2013 ano
6.125
+3.05
99.21%
1 jan 2014 ano
6.041
-0.084
-1.37%
Classificação de países por estatísticas atuais por anos
About & Feedback
Acordo
Privacidade
FAQ
Support 24/7
Cabinet
Get premium
Donate
The service accepts bank transfer (ACH, Wire) or cards (Visa, MasterCard, etc). Processed by Stripe.
Secured with SSL