33
/pt/
AIzaSyAYiBZKx7MnpbEhh9jyipgxe19OcubqV5w
August 1, 2025
133450
Finland
FIN
true
2
1
Net incurrence of liabilities, total (% of GDP)
1995,1994,1993,1992,1991,1990,1989,1988,1987,1986,1985,1984,1983,1982,1981,1980,1979,1978,1977,1976,1975,1974,1973
Download
Biblioteca de estatísticas globais →Finland →

Net incurrence of liabilities, total (% of GDP)

Estas estatísticas em outros países:

AfghanistanAlbaniaAlgeriaAngolaAntigua and BarbudaArmeniaAustraliaAustriaAzerbaijanBahamas, TheBahrainBangladeshBarbadosBelarusBelgiumBelizeBeninBhutanBoliviaBosnia and HerzegovinaBrazilBurkina FasoBurundiCabo VerdeCambodiaCanadaCentral African RepublicCentral Europe and the BalticsChileChinaColombiaCongo, Dem. Rep.Congo, Rep.Cote d'IvoireCroatiaCyprusCzech RepublicDominicaDominican RepublicEast Asia & Pacific (excluding high income)East Asia & Pacific (IDA & IBRD countries)Egypt, Arab Rep.El SalvadorEquatorial GuineaEstoniaEthiopiaEuro areaEurope & Central AsiaEurope & Central Asia (excluding high income)Europe & Central Asia (IDA & IBRD countries)European UnionFijiFinlandFranceGeorgiaGermanyGhanaGreeceGuatemalaHigh incomeHondurasHong Kong SAR, ChinaHungaryIBRD onlyIcelandIDA & IBRD totalIndiaIndonesiaIran, Islamic Rep.IraqIrelandIsraelItalyJamaicaJapanJordanKazakhstanKiribatiKorea, Rep.Kyrgyz RepublicLao PDRLate-demographic dividendLebanonLesothoLithuaniaLow & middle incomeLow incomeLower middle incomeLuxembourgMacedonia, FYRMadagascarMalawiMalaysiaMaldivesMaliMaltaMauritiusMicronesia, Fed. Sts.Middle East & North Africa (excluding high income)Middle East & North Africa (IDA & IBRD countries)Middle incomeMoldovaMongoliaMoroccoMozambiqueNamibiaNepalNetherlandsNew ZealandNigeriaNorth AmericaNorwayOECD membersOmanPacific island small statesParaguayPeruPhilippinesPolandPortugalPost-demographic dividendRomaniaRussian FederationRwandaSamoaSan MarinoSao Tome and PrincipeSenegalSerbiaSeychellesSierra LeoneSingaporeSlovak RepublicSolomon IslandsSouth AfricaSouth AsiaSouth Asia (IDA & IBRD)SpainSri LankaSt. Kitts and NevisSub-Saharan Africa Sub-Saharan Africa (excluding high income)Sub-Saharan Africa (IDA & IBRD countries)SurinameSwazilandSwedenSwitzerlandSyrian Arab RepublicTanzaniaThailandTogoTrinidad and TobagoTurkeyUgandaUkraineUnited Arab EmiratesUnited KingdomUnited StatesUpper middle incomeUruguayVanuatuVietnamWest Bank and GazaZimbabwe

Linha do tempo:

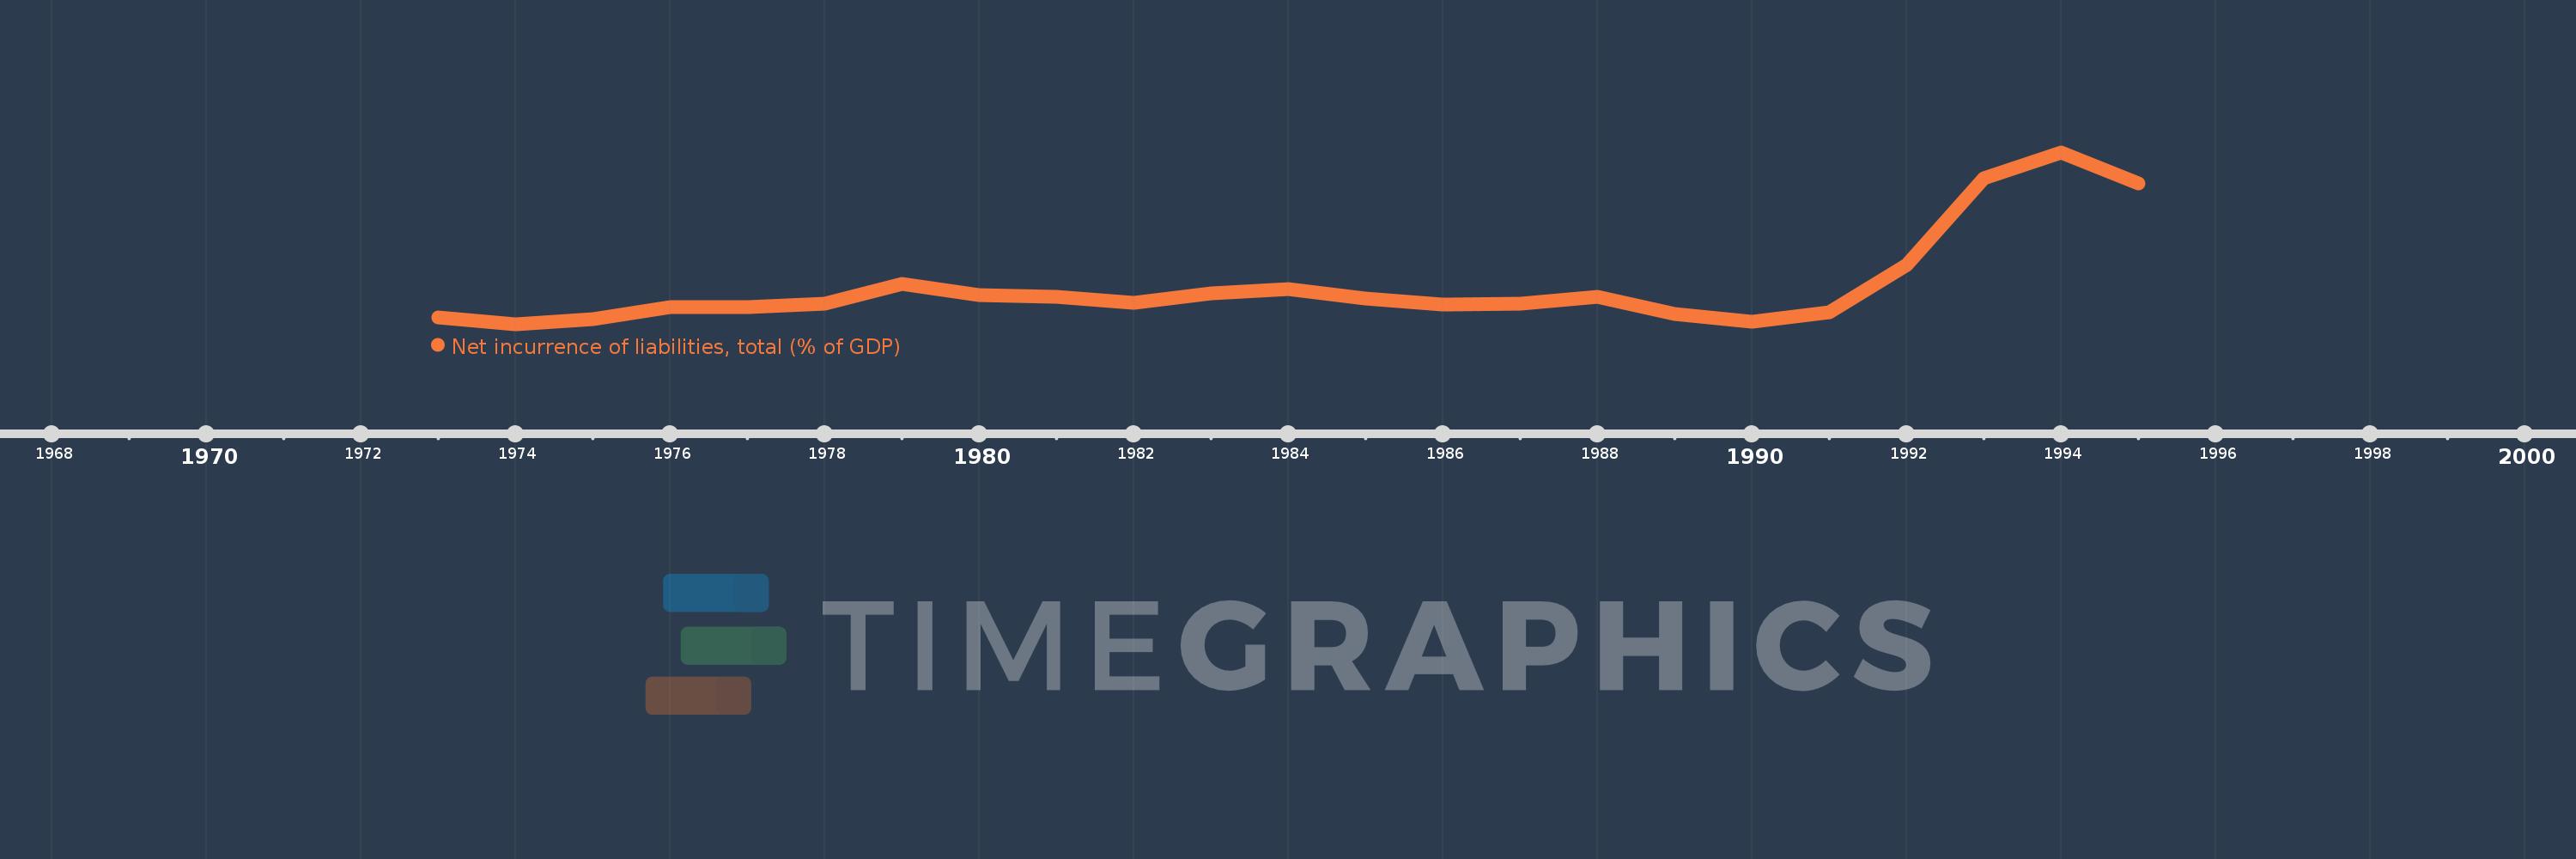
Nesta escala de tempo está apresentado um gráfico de 1973 ano até 1995 ano Finland. Dados de 1972 ano ausente. O número de observações reais por data: 23.

Fonte (nome):

Indicadores de desenvolvimento mundial

Fonte (organização):

International Monetary Fund, Government Finance Statistics Yearbook and data files.

Categorias:

Public Sector

Foi atualizado:

23 abr 2017 ano

Indicadores de alterações dos valores ao longo dos anos

Em média:
2.957
Mínimo:
-1.031
1 jan 1974 ano
Máximo:
16.717
1 jan 1994 ano
Na data de observação
Valor
Mudança absoluta
A alteração em relação ao valor anterior
1 jan 1973 ano
-0.34
-0.34
0.0%
1 jan 1974 ano
-1.031
-0.691
203.35%
1 jan 1975 ano
-0.477
+0.554
-53.71%
1 jan 1976 ano
0.705
+1.182
-247.69%
1 jan 1977 ano
0.75
+0.045
6.4%
1 jan 1978 ano
1.127
+0.376
50.18%
1 jan 1979 ano
3.117
+1.99
176.62%
1 jan 1980 ano
1.97
-1.146
-36.78%
1 jan 1981 ano
1.777
-0.193
-9.8%
1 jan 1982 ano
1.215
-0.562
-31.63%
1 jan 1983 ano
2.135
+0.92
75.72%
1 jan 1984 ano
2.618
+0.483
22.64%
1 jan 1985 ano
1.666
-0.952
-36.38%
1 jan 1986 ano
1.011
-0.655
-39.29%
1 jan 1987 ano
1.115
+0.104
10.23%
1 jan 1988 ano
1.812
+0.697
62.52%
1 jan 1989 ano
0.063
-1.749
-96.54%
1 jan 1990 ano
-0.788
-0.85
-1.36 mil%
1 jan 1991 ano
0.22
+1.008
-127.94%
1 jan 1992 ano
5.114
+4.894
2.22 mil%
1 jan 1993 ano
14.017
+8.903
174.11%
1 jan 1994 ano
16.717
+2.7
19.26%
1 jan 1995 ano
13.493
-3.224
-19.29%

Classificação de países por estatísticas atuais por anos