33
/pt/
AIzaSyB4mHJ5NPEv-XzF7P6NDYXjlkCWaeKw5bc
November 1, 2025
259077
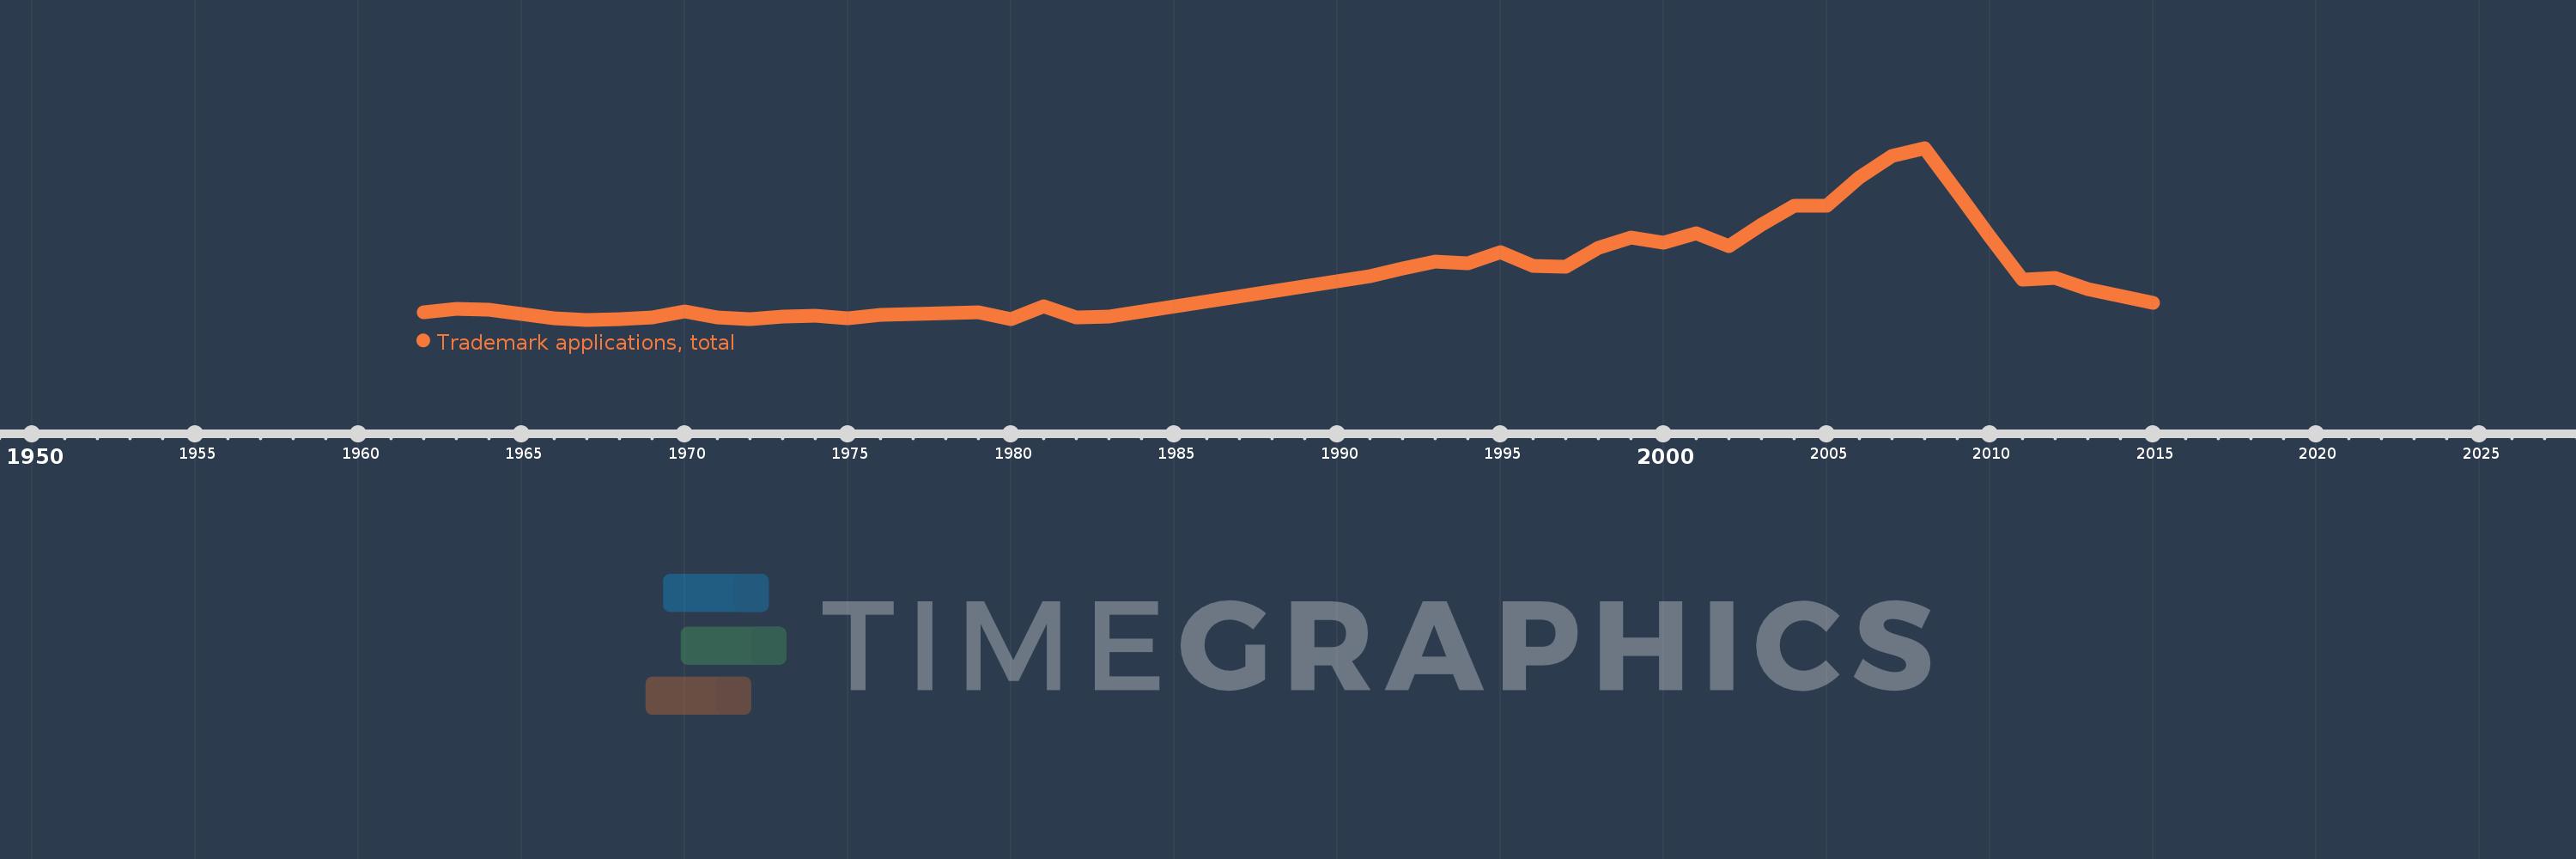
Syrian Arab Republic
SYR
true
2
1
Trademark applications, total
2015,2014,2013,2012,2011,2010,2009,2008,2007,2006,2005,2004,2003,2002,2001,2000,1999,1998,1997,1996,1995,1994,1993,1992,1991,1983,1982,1981,1980,1979,1976,1975,1974,1973,1972,1971,1970,1969,1968,1967,1966,1964,1963,1962