33
/pt/
AIzaSyAYiBZKx7MnpbEhh9jyipgxe19OcubqV5w
August 1, 2025
232895
Samoa
WSM
true
2
1
Trademark applications, total
2015,2013,2008,2007,2005,2004,2000,1997,1996,1994,1992,1986,1985,1982,1981,1980,1979,1978,1977,1976,1975,1974
Download
Biblioteca de estatísticas globais →Samoa →

Trademark applications, total

Estas estatísticas em outros países:

AlbaniaAlgeriaAndorraAngolaAntigua and BarbudaArab WorldArgentinaArmeniaArubaAustraliaAustriaAzerbaijanBahamas, TheBahrainBangladeshBarbadosBelarusBelgiumBelizeBhutanBoliviaBosnia and HerzegovinaBotswanaBrazilBrunei DarussalamBulgariaBurkina FasoBurundiCabo VerdeCambodiaCanadaCaribbean small statesCentral Europe and the BalticsChileChinaColombiaComorosCongo, Dem. Rep.Costa RicaCroatiaCubaCuracaoCyprusCzech RepublicDenmarkDjiboutiDominicaDominican RepublicEarly-demographic dividendEast Asia & PacificEast Asia & Pacific (excluding high income)East Asia & Pacific (IDA & IBRD countries)EcuadorEgypt, Arab Rep.El SalvadorEquatorial GuineaEstoniaEthiopiaEuro areaEurope & Central AsiaEurope & Central Asia (excluding high income)Europe & Central Asia (IDA & IBRD countries)European UnionFijiFinlandFranceGambia, TheGeorgiaGermanyGhanaGreeceGrenadaGuatemalaGuineaGuinea-BissauGuyanaHaitiHigh incomeHondurasHong Kong SAR, ChinaHungaryIBRD onlyIcelandIDA & IBRD totalIDA blendIDA onlyIDA totalIndiaIndonesiaIran, Islamic Rep.IraqIrelandIsraelItalyJamaicaJapanJordanKazakhstanKenyaKiribatiKorea, Dem. People’s Rep.Korea, Rep.KuwaitKyrgyz RepublicLao PDRLate-demographic dividendLatin America & Caribbean Latin America & Caribbean (excluding high income)Latin America & the Caribbean (IDA & IBRD countries)LatviaLeast developed countries: UN classificationLebanonLesothoLiberiaLibyaLiechtensteinLithuaniaLow & middle incomeLower middle incomeLuxembourgMacao SAR, ChinaMacedonia, FYRMadagascarMalawiMalaysiaMaldivesMaliMaltaMauritiusMexicoMiddle East & North AfricaMiddle East & North Africa (excluding high income)Middle East & North Africa (IDA & IBRD countries)Middle incomeMoldovaMonacoMongoliaMontenegroMoroccoMozambiqueMyanmarNamibiaNepalNetherlandsNew ZealandNicaraguaNigeriaNorth AmericaNorwayOECD membersOmanOther small statesPacific island small statesPakistanPanamaPapua New GuineaParaguayPeruPhilippinesPolandPortugalPost-demographic dividendQatarRomaniaRussian FederationRwandaSamoaSan MarinoSao Tome and PrincipeSaudi ArabiaSerbiaSeychellesSierra LeoneSingaporeSint Maarten (Dutch part)Slovak RepublicSloveniaSmall statesSolomon IslandsSomaliaSouth AfricaSouth AsiaSouth Asia (IDA & IBRD)SpainSri LankaSt. LuciaSt. Vincent and the GrenadinesSudanSurinameSwazilandSwedenSwitzerlandSyrian Arab RepublicTajikistanTanzaniaThailandTongaTrinidad and TobagoTunisiaTurkeyTurkmenistanTuvaluUgandaUkraineUnited Arab EmiratesUnited KingdomUnited StatesUpper middle incomeUruguayUzbekistanVenezuela, RBVietnamWorldYemen, Rep.ZambiaZimbabwe

Linha do tempo:

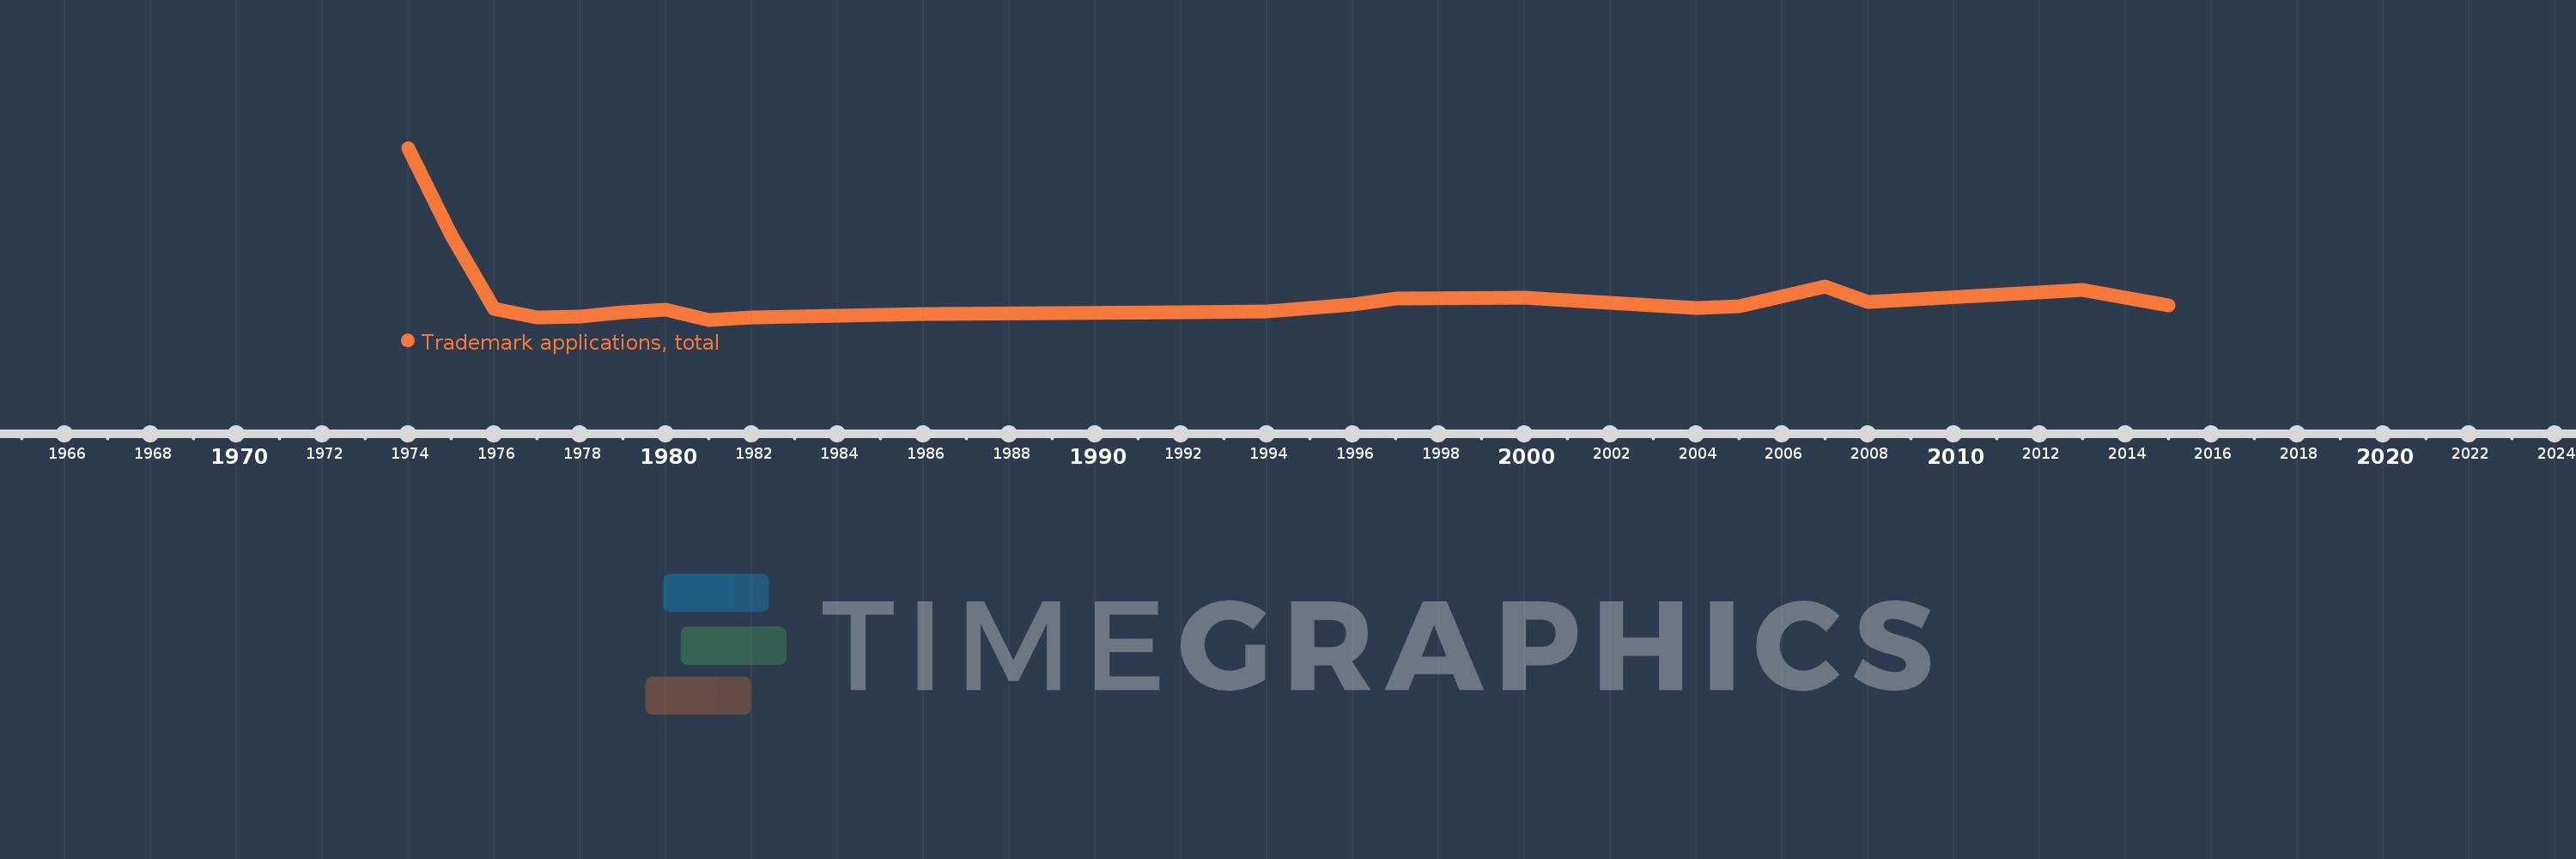
Nesta escala de tempo está apresentado um gráfico de 1974 ano até 2015 ano Samoa. Dados de 1973 ano ausente. O número de observações reais por data: 22.

Fonte (nome):

Indicadores de desenvolvimento mundial

Fonte (organização):

World Intellectual Property Organization (WIPO), World Intellectual Property Indicators and www.wipo.int/econ_stat. The International Bureau of WIPO assumes no responsibility with respect to the transformation of these data.

Categorias:

Science & Technology

Foi atualizado:

23 abr 2017 ano

Indicadores de alterações dos valores ao longo dos anos

Em média:
186.5
Mínimo:
55.0
1 jan 1981 ano
Máximo:
1.052 mil
1 jan 1974 ano
Na data de observação
Valor
Mudança absoluta
A alteração em relação ao valor anterior
1 jan 1974 ano
1.052 mil
+1.052 mil
0.0%
1 jan 1975 ano
547.0
-505.0
-48.0%
1 jan 1976 ano
116.0
-431.0
-78.79%
1 jan 1977 ano
68.0
-48.0
-41.38%
1 jan 1978 ano
72.0
+4.0
5.88%
1 jan 1979 ano
98.0
+26.0
36.11%
1 jan 1980 ano
113.0
+15.0
15.31%
1 jan 1981 ano
55.0
-58.0
-51.33%
1 jan 1982 ano
66.0
+11.0
20.0%
1 jan 1985 ano
85.0
+19.0
28.79%
1 jan 1986 ano
90.0
+5.0
5.88%
1 jan 1992 ano
99.0
+9.0
10.0%
1 jan 1994 ano
105.0
+6.0
6.06%
1 jan 1996 ano
144.0
+39.0
37.14%
1 jan 1997 ano
179.0
+35.0
24.31%
1 jan 2000 ano
183.0
+4.0
2.23%
1 jan 2004 ano
124.0
-59.0
-32.24%
1 jan 2005 ano
133.0
+9.0
7.26%
1 jan 2007 ano
248.0
+115.0
86.47%
1 jan 2008 ano
159.0
-89.0
-35.89%
1 jan 2013 ano
228.0
+69.0
43.4%
1 jan 2015 ano
139.0
-89.0
-39.04%

Classificação de países por estatísticas atuais por anos