33
/pt/
AIzaSyB4mHJ5NPEv-XzF7P6NDYXjlkCWaeKw5bc
November 1, 2025
252284
St. Vincent and the Grenadines
VCT
true
2
1
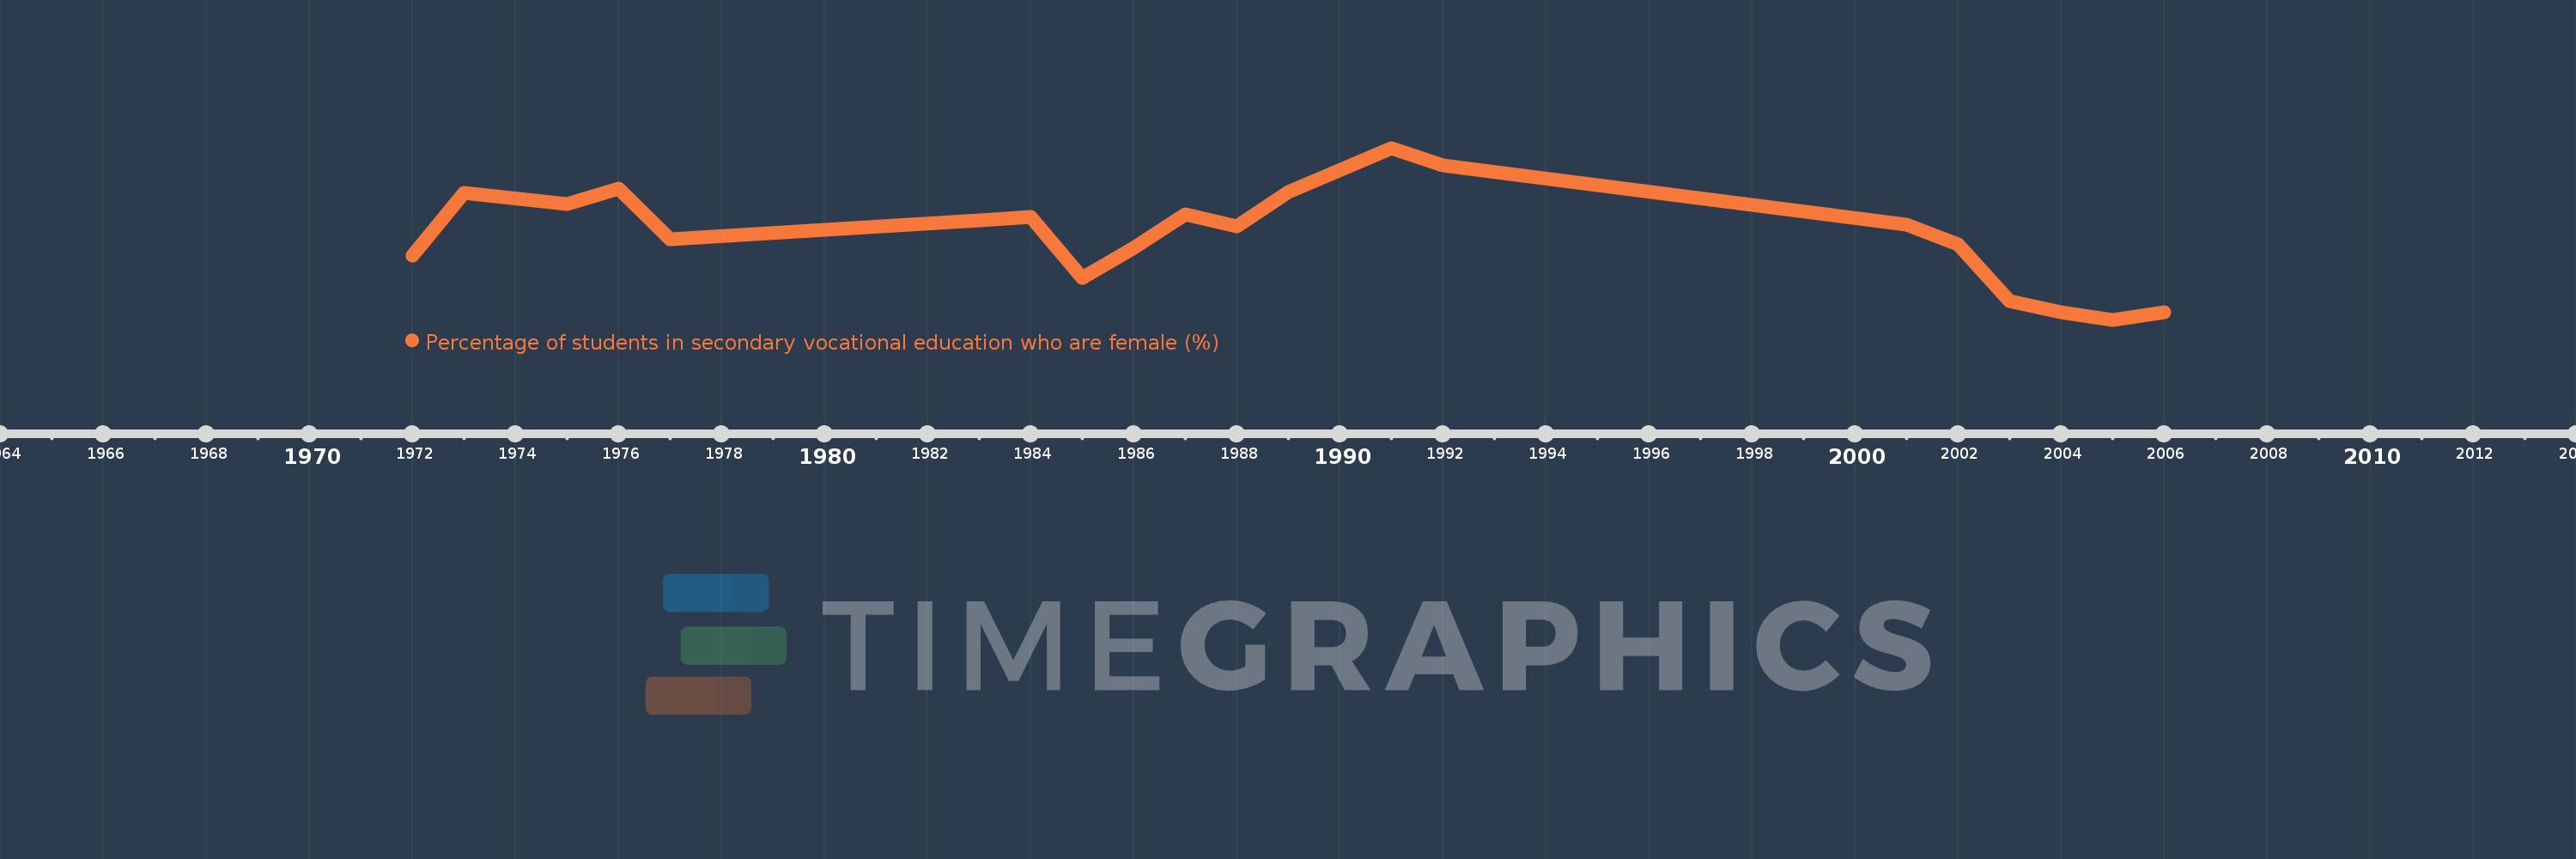
Percentage of students in secondary vocational education who are female (%)
2006,2005,2004,2003,2002,2001,1992,1991,1989,1988,1987,1986,1985,1984,1983,1977,1976,1975,1973,1972