33
/pt/
AIzaSyB4mHJ5NPEv-XzF7P6NDYXjlkCWaeKw5bc
November 1, 2025
198595
Monaco
MCO
true
2
1
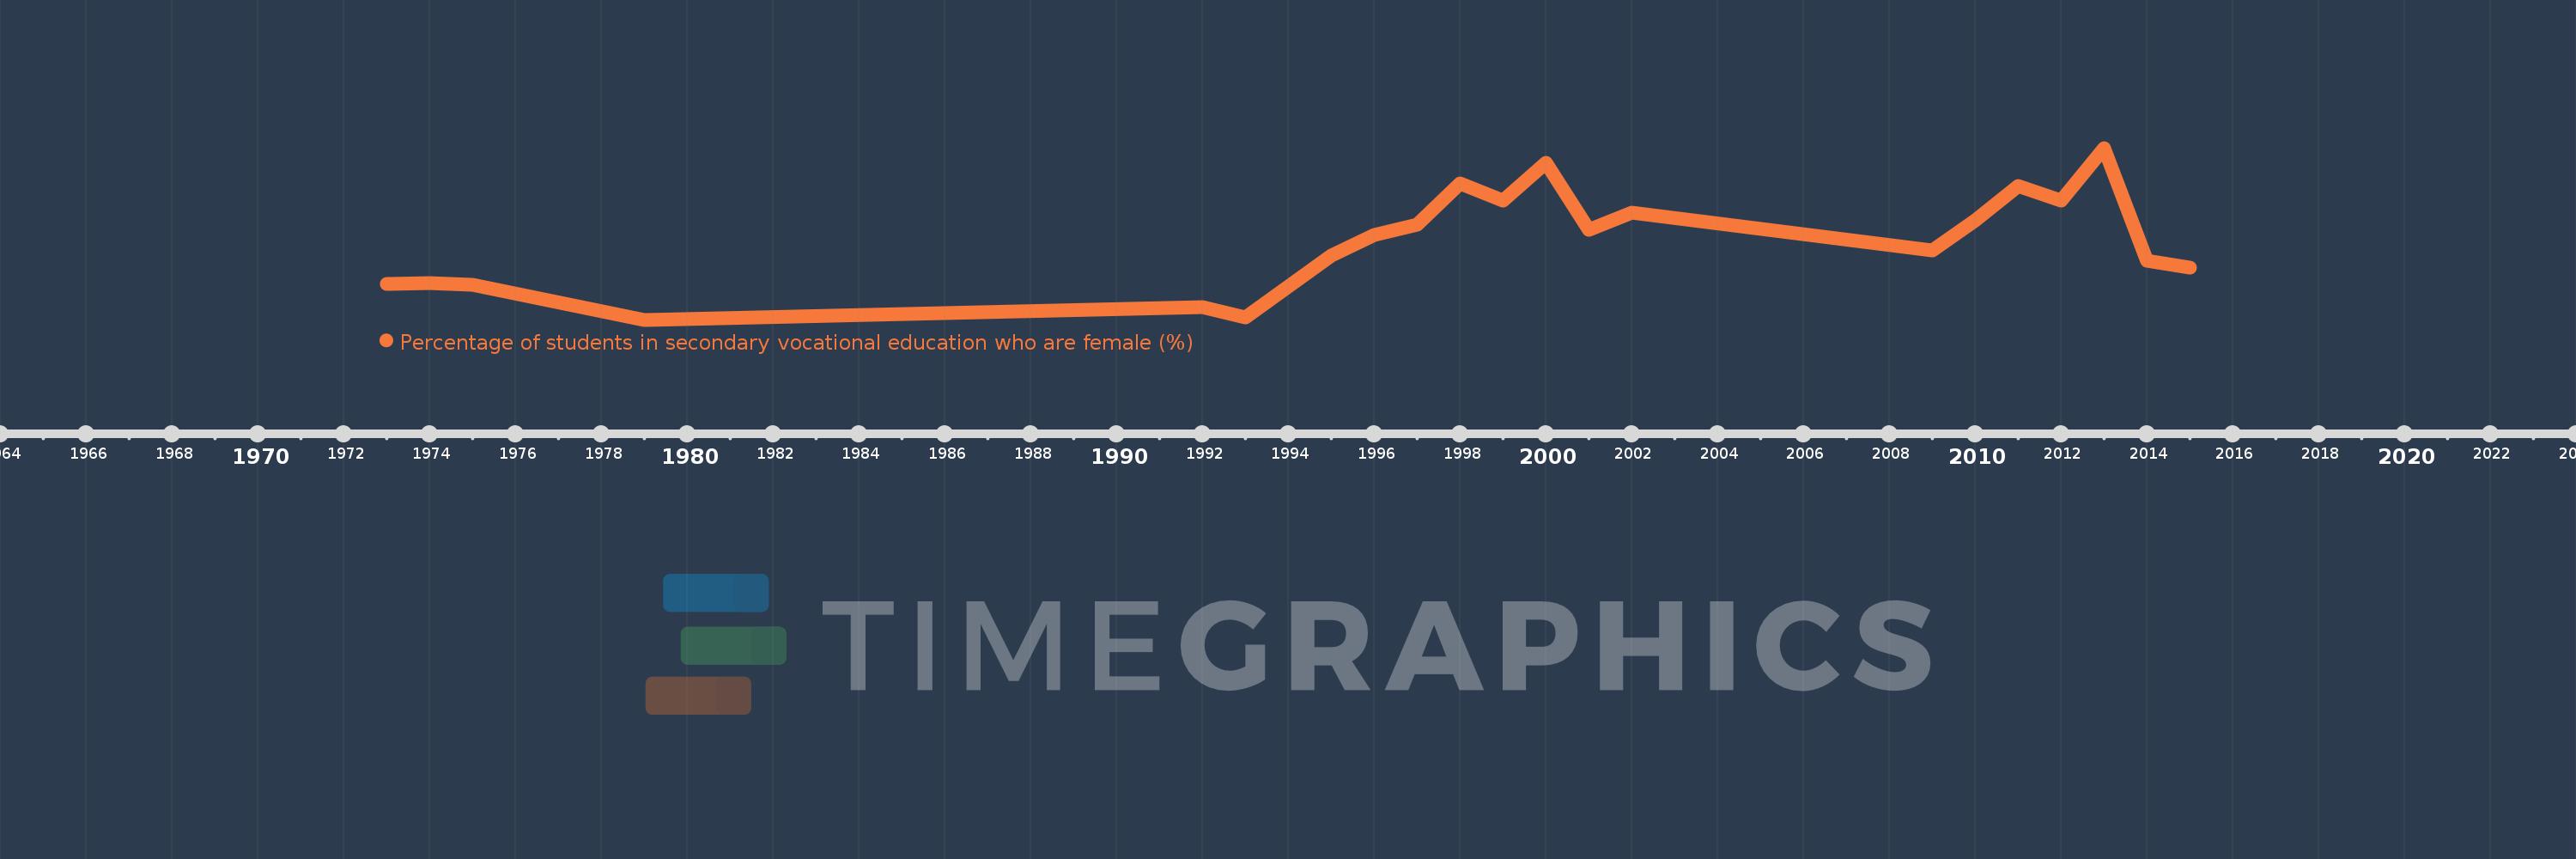
Percentage of students in secondary vocational education who are female (%)
2015,2014,2013,2012,2011,2010,2009,2002,2001,2000,1999,1998,1997,1996,1995,1993,1992,1979,1975,1974,1973