33
/pt/
AIzaSyAYiBZKx7MnpbEhh9jyipgxe19OcubqV5w
August 1, 2025
224874
Poland
POL
true
2
1
GNI per capita growth (annual %)
2016,2015,2014,2013,2012,2011,2010,2009,2008,2007,2006,2005,2004,2003,2002,2001,2000,1999,1998,1997,1996,1995,1994,1993
Download
Biblioteca de estatísticas globais →Poland →

GNI per capita growth (annual %)

Estas estatísticas em outros países:

AlbaniaAlgeriaAngolaAntigua and BarbudaArab WorldArgentinaArmeniaAustraliaAustriaAzerbaijanBahamas, TheBahrainBangladeshBarbadosBelarusBelgiumBelizeBeninBhutanBoliviaBosnia and HerzegovinaBotswanaBrazilBrunei DarussalamBulgariaBurkina FasoBurundiCabo VerdeCambodiaCameroonCanadaCaribbean small statesCentral Europe and the BalticsChadChileChinaColombiaComorosCongo, Dem. Rep.Congo, Rep.Costa RicaCote d'IvoireCroatiaCubaCyprusCzech RepublicDenmarkDjiboutiDominican RepublicEarly-demographic dividendEast Asia & PacificEast Asia & Pacific (excluding high income)East Asia & Pacific (IDA & IBRD countries)EcuadorEgypt, Arab Rep.El SalvadorEquatorial GuineaEritreaEstoniaEthiopiaEuro areaEurope & Central AsiaEurope & Central Asia (excluding high income)Europe & Central Asia (IDA & IBRD countries)European UnionFijiFinlandFranceGabonGambia, TheGeorgiaGermanyGhanaGreeceGuatemalaGuineaGuinea-BissauHaitiHeavily indebted poor countries (HIPC)High incomeHondurasHong Kong SAR, ChinaHungaryIBRD onlyIcelandIDA & IBRD totalIDA blendIDA onlyIDA totalIndiaIndonesiaIran, Islamic Rep.IrelandIsraelItalyJamaicaJapanJordanKazakhstanKenyaKorea, Rep.KosovoKuwaitKyrgyz RepublicLao PDRLate-demographic dividendLatin America & Caribbean Latin America & Caribbean (excluding high income)Latin America & the Caribbean (IDA & IBRD countries)LatviaLeast developed countries: UN classificationLebanonLiberiaLibyaLithuaniaLow & middle incomeLow incomeLower middle incomeLuxembourgMacao SAR, ChinaMacedonia, FYRMadagascarMalawiMalaysiaMaliMaltaMauritaniaMauritiusMexicoMiddle East & North AfricaMiddle East & North Africa (excluding high income)Middle East & North Africa (IDA & IBRD countries)Middle incomeMoldovaMongoliaMontenegroMoroccoMozambiqueMyanmarNamibiaNepalNetherlandsNew ZealandNicaraguaNigerNigeriaNorth AmericaNorwayOECD membersOmanOther small statesPakistanPanamaPapua New GuineaParaguayPeruPhilippinesPolandPortugalPost-demographic dividendPre-demographic dividendPuerto RicoQatarRomaniaRussian FederationRwandaSamoaSaudi ArabiaSenegalSerbiaSeychellesSierra LeoneSingaporeSlovak RepublicSloveniaSmall statesSomaliaSouth AfricaSouth AsiaSouth Asia (IDA & IBRD)South SudanSpainSri LankaSub-Saharan Africa Sub-Saharan Africa (excluding high income)Sub-Saharan Africa (IDA & IBRD countries)SudanSurinameSwazilandSwedenSwitzerlandSyrian Arab RepublicTajikistanTanzaniaThailandTimor-LesteTogoTrinidad and TobagoTunisiaTurkeyTurkmenistanUgandaUkraineUnited Arab EmiratesUnited KingdomUnited StatesUpper middle incomeUruguayUzbekistanVanuatuVenezuela, RBVietnamWest Bank and GazaWorldZambiaZimbabwe

Linha do tempo:

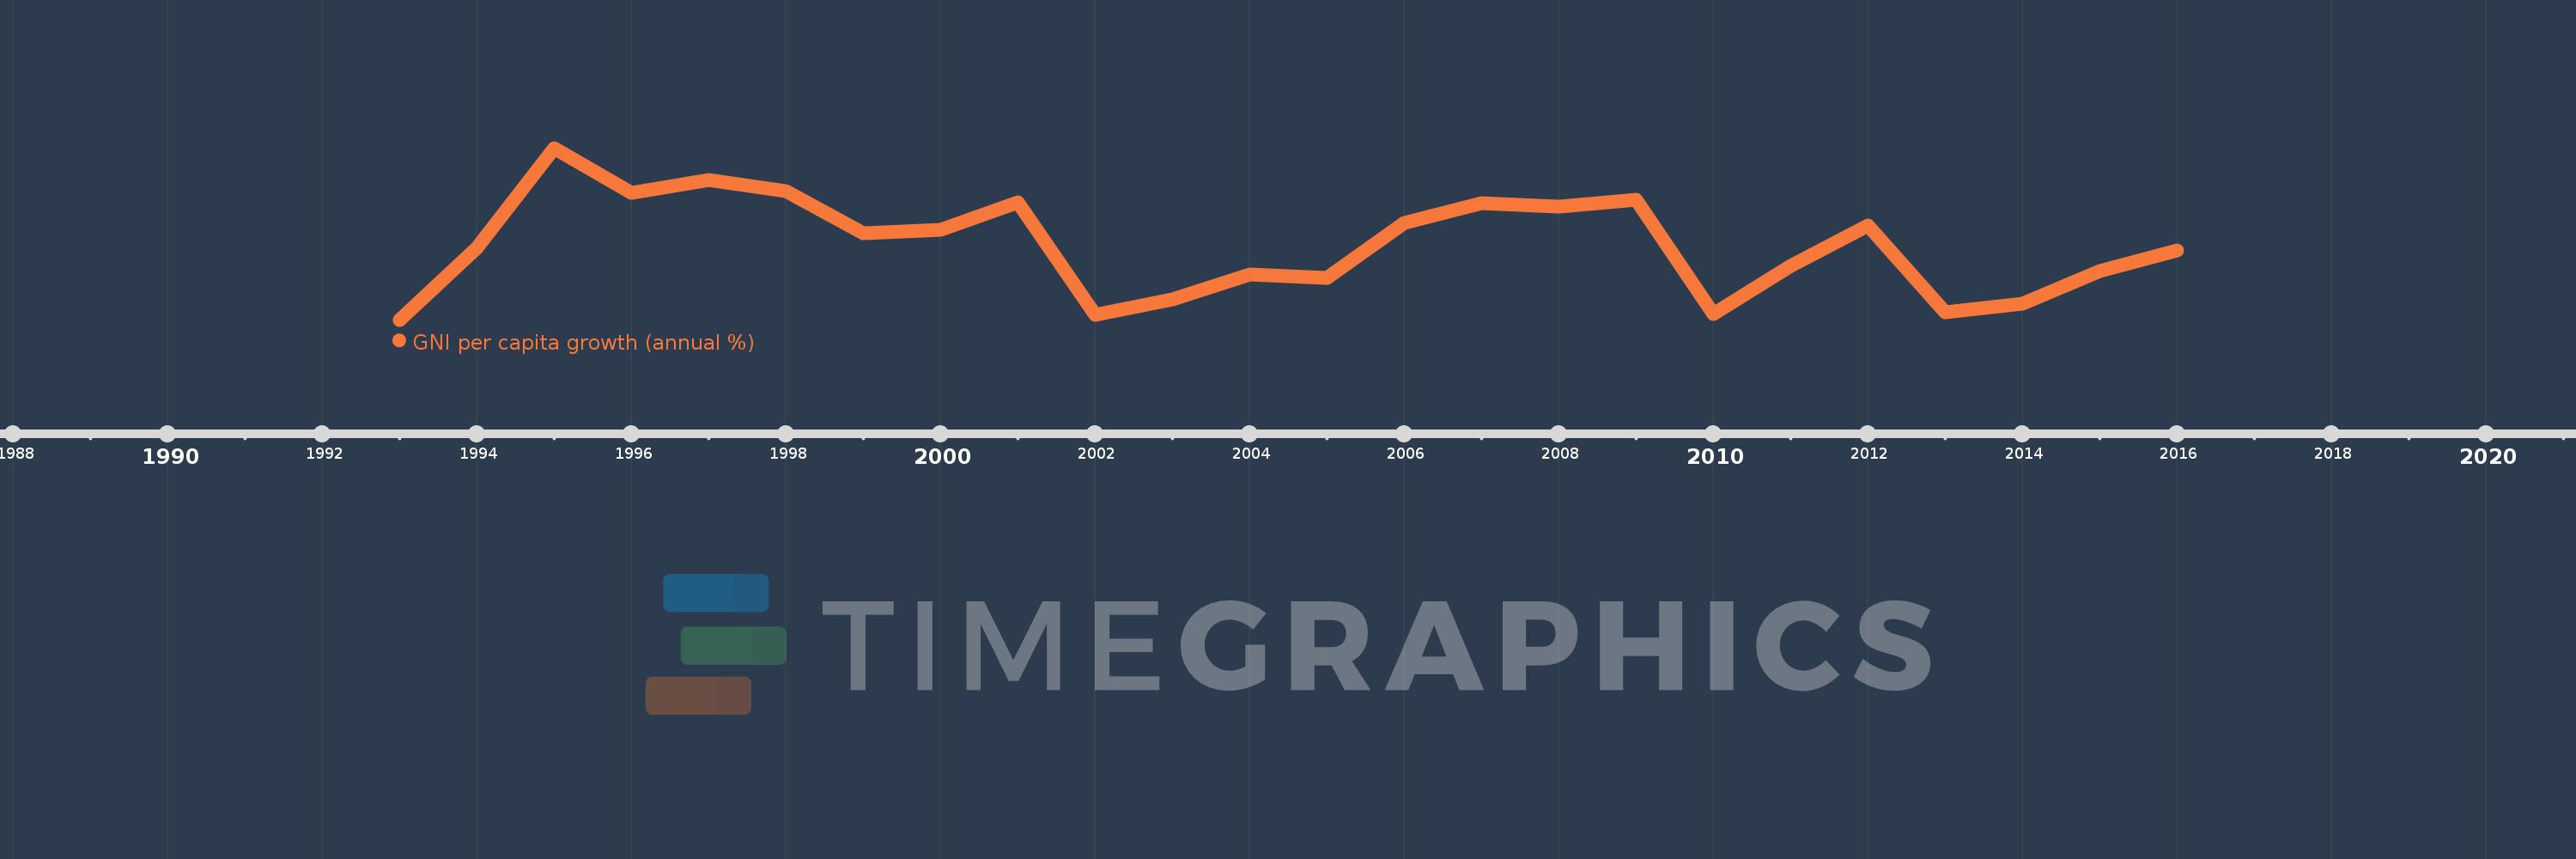
Nesta escala de tempo está apresentado um gráfico de 1993 ano até 2016 ano Poland. Dados de 1992 ano ausente. O número de observações reais por data: 24.

Fonte (nome):

Indicadores de desenvolvimento mundial

Fonte (organização):

World Bank national accounts data, and OECD National Accounts data files.

Categorias:

Economy & Growth

Foi atualizado:

23 abr 2017 ano

Indicadores de alterações dos valores ao longo dos anos

Em média:
4.165
Mínimo:
1.199
1 jan 1993 ano
Máximo:
8.059
1 jan 1995 ano
Na data de observação
Valor
Mudança absoluta
A alteração em relação ao valor anterior
1 jan 1993 ano
1.199
+1.199
0.0%
1 jan 1994 ano
4.077
+2.879
240.17%
1 jan 1995 ano
8.059
+3.981
97.64%
1 jan 1996 ano
6.249
-1.81
-22.46%
1 jan 1997 ano
6.784
+0.535
8.56%
1 jan 1998 ano
6.32
-0.463
-6.83%
1 jan 1999 ano
4.638
-1.682
-26.61%
1 jan 2000 ano
4.776
+0.137
2.96%
1 jan 2001 ano
5.876
+1.101
23.05%
1 jan 2002 ano
1.391
-4.485
-76.33%
1 jan 2003 ano
1.998
+0.607
43.62%
1 jan 2004 ano
2.992
+0.995
49.81%
1 jan 2005 ano
2.858
-0.134
-4.48%
1 jan 2006 ano
5.054
+2.195
76.8%
1 jan 2007 ano
5.857
+0.803
15.89%
1 jan 2008 ano
5.713
-0.144
-2.46%
1 jan 2009 ano
5.974
+0.262
4.58%
1 jan 2010 ano
1.418
-4.556
-76.27%
1 jan 2011 ano
3.333
+1.915
135.09%
1 jan 2012 ano
4.952
+1.618
48.55%
1 jan 2013 ano
1.501
-3.451
-69.69%
1 jan 2014 ano
1.83
+0.33
21.96%
1 jan 2015 ano
3.153
+1.323
72.28%
1 jan 2016 ano
3.95
+0.797
25.27%

Classificação de países por estatísticas atuais por anos