33
/pt/
AIzaSyAYiBZKx7MnpbEhh9jyipgxe19OcubqV5w
August 1, 2025
145693
Guinea
GIN
true
2
1
GNI per capita growth (annual %)
2016,2015,2014,2013,2012,2011,2010,2009,2008,2004,2003,2002,2001,2000,1999,1998,1997,1996,1995,1994,1993,1992,1991,1990,1989,1988
Download
Biblioteca de estatísticas globais →Guinea →

GNI per capita growth (annual %)

Estas estatísticas em outros países:

AlbaniaAlgeriaAngolaAntigua and BarbudaArab WorldArgentinaArmeniaAustraliaAustriaAzerbaijanBahamas, TheBahrainBangladeshBarbadosBelarusBelgiumBelizeBeninBhutanBoliviaBosnia and HerzegovinaBotswanaBrazilBrunei DarussalamBulgariaBurkina FasoBurundiCabo VerdeCambodiaCameroonCanadaCaribbean small statesCentral Europe and the BalticsChadChileChinaColombiaComorosCongo, Dem. Rep.Congo, Rep.Costa RicaCote d'IvoireCroatiaCubaCyprusCzech RepublicDenmarkDjiboutiDominican RepublicEarly-demographic dividendEast Asia & PacificEast Asia & Pacific (excluding high income)East Asia & Pacific (IDA & IBRD countries)EcuadorEgypt, Arab Rep.El SalvadorEquatorial GuineaEritreaEstoniaEthiopiaEuro areaEurope & Central AsiaEurope & Central Asia (excluding high income)Europe & Central Asia (IDA & IBRD countries)European UnionFijiFinlandFranceGabonGambia, TheGeorgiaGermanyGhanaGreeceGuatemalaGuineaGuinea-BissauHaitiHeavily indebted poor countries (HIPC)High incomeHondurasHong Kong SAR, ChinaHungaryIBRD onlyIcelandIDA & IBRD totalIDA blendIDA onlyIDA totalIndiaIndonesiaIran, Islamic Rep.IrelandIsraelItalyJamaicaJapanJordanKazakhstanKenyaKorea, Rep.KosovoKuwaitKyrgyz RepublicLao PDRLate-demographic dividendLatin America & Caribbean Latin America & Caribbean (excluding high income)Latin America & the Caribbean (IDA & IBRD countries)LatviaLeast developed countries: UN classificationLebanonLiberiaLibyaLithuaniaLow & middle incomeLow incomeLower middle incomeLuxembourgMacao SAR, ChinaMacedonia, FYRMadagascarMalawiMalaysiaMaliMaltaMauritaniaMauritiusMexicoMiddle East & North AfricaMiddle East & North Africa (excluding high income)Middle East & North Africa (IDA & IBRD countries)Middle incomeMoldovaMongoliaMontenegroMoroccoMozambiqueMyanmarNamibiaNepalNetherlandsNew ZealandNicaraguaNigerNigeriaNorth AmericaNorwayOECD membersOmanOther small statesPakistanPanamaPapua New GuineaParaguayPeruPhilippinesPolandPortugalPost-demographic dividendPre-demographic dividendPuerto RicoQatarRomaniaRussian FederationRwandaSamoaSaudi ArabiaSenegalSerbiaSeychellesSierra LeoneSingaporeSlovak RepublicSloveniaSmall statesSomaliaSouth AfricaSouth AsiaSouth Asia (IDA & IBRD)South SudanSpainSri LankaSub-Saharan Africa Sub-Saharan Africa (excluding high income)Sub-Saharan Africa (IDA & IBRD countries)SudanSurinameSwazilandSwedenSwitzerlandSyrian Arab RepublicTajikistanTanzaniaThailandTimor-LesteTogoTrinidad and TobagoTunisiaTurkeyTurkmenistanUgandaUkraineUnited Arab EmiratesUnited KingdomUnited StatesUpper middle incomeUruguayUzbekistanVanuatuVenezuela, RBVietnamWest Bank and GazaWorldZambiaZimbabwe

Linha do tempo:

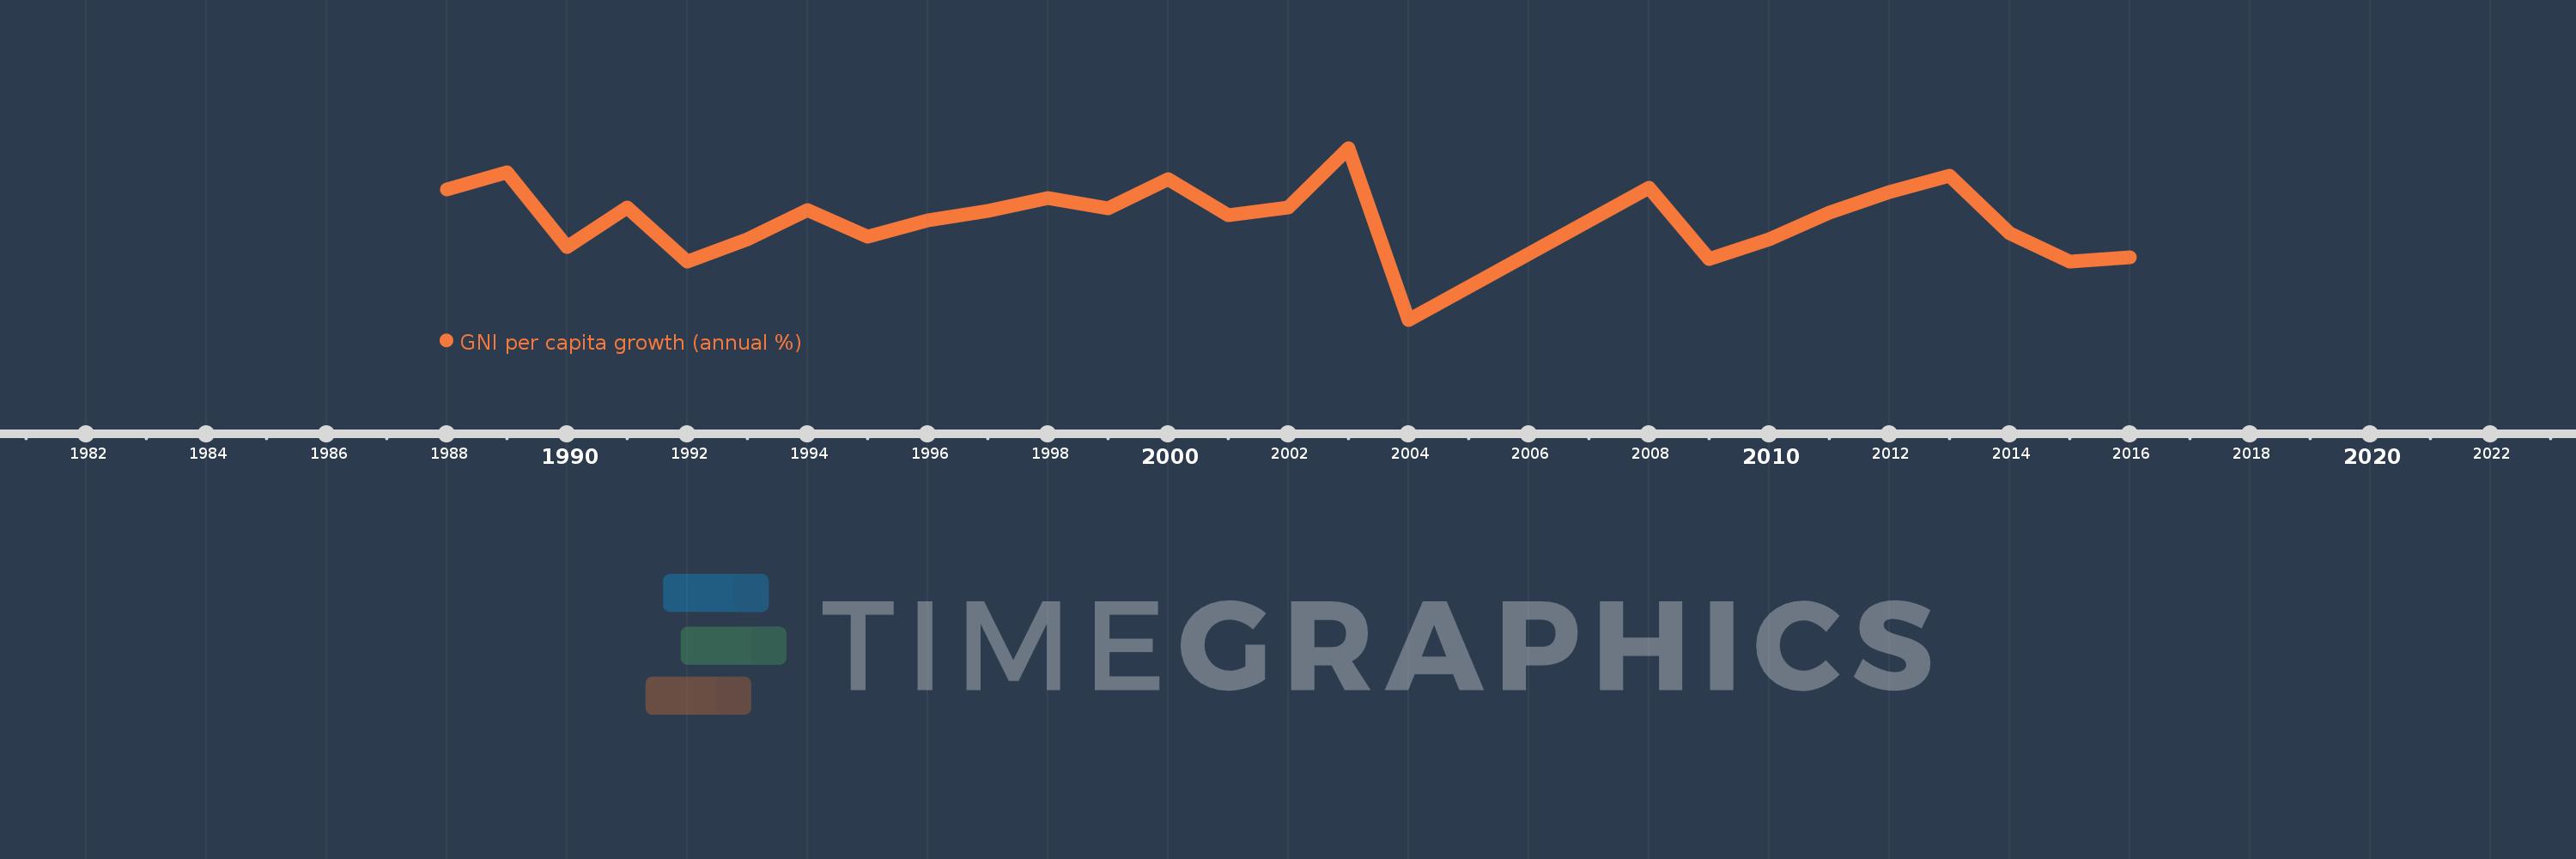
Nesta escala de tempo está apresentado um gráfico de 1988 ano até 2016 ano Guinea. Dados de 1987 ano ausente. O número de observações reais por data: 26.

Fonte (nome):

Indicadores de desenvolvimento mundial

Fonte (organização):

World Bank national accounts data, and OECD National Accounts data files.

Categorias:

Economy & Growth

Foi atualizado:

23 abr 2017 ano

Indicadores de alterações dos valores ao longo dos anos

Em média:
0.415
Mínimo:
-6.645
1 jan 2004 ano
Máximo:
5.366
1 jan 2003 ano
Na data de observação
Valor
Mudança absoluta
A alteração em relação ao valor anterior
1 jan 1988 ano
2.458
+2.458
0.0%
1 jan 1989 ano
3.64
+1.182
48.11%
1 jan 1990 ano
-1.542
-5.182
-142.35%
1 jan 1991 ano
1.202
+2.744
-177.98%
1 jan 1992 ano
-2.594
-3.796
-315.74%
1 jan 1993 ano
-0.998
+1.596
-61.52%
1 jan 1994 ano
1.052
+2.05
-205.39%
1 jan 1995 ano
-0.836
-1.888
-179.48%
1 jan 1996 ano
0.303
+1.139
-136.23%
1 jan 1997 ano
0.953
+0.65
214.54%
1 jan 1998 ano
1.859
+0.907
95.15%
1 jan 1999 ano
1.147
-0.712
-38.32%
1 jan 2000 ano
3.216
+2.069
180.45%
1 jan 2001 ano
0.636
-2.58
-80.22%
1 jan 2002 ano
1.178
+0.542
85.25%
1 jan 2003 ano
5.366
+4.188
355.4%
1 jan 2004 ano
-6.645
-12.011
-223.84%
1 jan 2008 ano
2.584
+9.23
-138.89%
1 jan 2009 ano
-2.39
-4.975
-192.49%
1 jan 2010 ano
-1.025
+1.365
-57.12%
1 jan 2011 ano
0.87
+1.895
-184.85%
1 jan 2012 ano
2.308
+1.438
165.39%
1 jan 2013 ano
3.446
+1.138
49.3%
1 jan 2014 ano
-0.573
-4.019
-116.62%
1 jan 2015 ano
-2.566
-1.993
347.95%
1 jan 2016 ano
-2.268
+0.298
-11.63%

Classificação de países por estatísticas atuais por anos