33
/pt/
AIzaSyAYiBZKx7MnpbEhh9jyipgxe19OcubqV5w
August 1, 2025
220422
Paraguay
PRY
true
2
1
Adult literacy rate, population 15+ years, both sexes (%)
2016,2015,2011,2010,2009,2008,1993,1983
Download
Biblioteca de estatísticas globais →Paraguay →

Adult literacy rate, population 15+ years, both sexes (%)

Estas estatísticas em outros países:

AfghanistanAlbaniaAlgeriaAmerican SamoaAngolaAntigua and BarbudaArab WorldArgentinaArmeniaArubaAzerbaijanBahrainBangladeshBarbadosBelarusBelizeBeninBhutanBoliviaBosnia and HerzegovinaBotswanaBrazilBrunei DarussalamBulgariaBurkina FasoBurundiCabo VerdeCambodiaCameroonCaribbean small statesCayman IslandsCentral African RepublicCentral Europe and the BalticsChadChileChinaColombiaComorosCongo, Dem. Rep.Congo, Rep.Costa RicaCote d'IvoireCroatiaCubaCyprusDominican RepublicEarly-demographic dividendEast Asia & PacificEast Asia & Pacific (excluding high income)East Asia & Pacific (IDA & IBRD countries)EcuadorEgypt, Arab Rep.El SalvadorEquatorial GuineaEritreaEstoniaEthiopiaEurope & Central AsiaEurope & Central Asia (excluding high income)Europe & Central Asia (IDA & IBRD countries)Fragile and conflict affected situationsGabonGambia, TheGeorgiaGhanaGreeceGrenadaGuamGuatemalaGuineaGuinea-BissauGuyanaHaitiHeavily indebted poor countries (HIPC)HondurasHungaryIBRD onlyIDA & IBRD totalIDA blendIDA onlyIDA totalIndiaIndonesiaIran, Islamic Rep.IraqIsraelItalyJamaicaJordanKazakhstanKenyaKorea, Dem. People’s Rep.Korea, Rep.KuwaitKyrgyz RepublicLao PDRLate-demographic dividendLatin America & Caribbean Latin America & Caribbean (excluding high income)Latin America & the Caribbean (IDA & IBRD countries)LatviaLeast developed countries: UN classificationLebanonLesothoLiberiaLibyaLithuaniaLow & middle incomeLow incomeLower middle incomeMacao SAR, ChinaMacedonia, FYRMadagascarMalawiMalaysiaMaldivesMaliMaltaMarshall IslandsMauritaniaMauritiusMexicoMiddle East & North AfricaMiddle East & North Africa (excluding high income)Middle East & North Africa (IDA & IBRD countries)Middle incomeMoldovaMongoliaMontenegroMoroccoMozambiqueMyanmarNamibiaNepalNew CaledoniaNicaraguaNigerNigeriaOmanOther small statesPacific island small statesPakistanPalauPanamaPapua New GuineaParaguayPeruPhilippinesPolandPortugalPre-demographic dividendPuerto RicoQatarRomaniaRussian FederationRwandaSamoaSao Tome and PrincipeSaudi ArabiaSenegalSerbiaSeychellesSierra LeoneSingaporeSloveniaSmall statesSolomon IslandsSouth AfricaSouth AsiaSouth Asia (IDA & IBRD)South SudanSpainSri LankaSt. Vincent and the GrenadinesSub-Saharan Africa Sub-Saharan Africa (excluding high income)Sub-Saharan Africa (IDA & IBRD countries)SudanSurinameSwazilandSyrian Arab RepublicTajikistanTanzaniaThailandTimor-LesteTogoTongaTrinidad and TobagoTunisiaTurkeyTurkmenistanUgandaUkraineUnited Arab EmiratesUpper middle incomeUruguayUzbekistanVanuatuVenezuela, RBVietnamWest Bank and GazaWorldYemen, Rep.ZambiaZimbabwe

Linha do tempo:

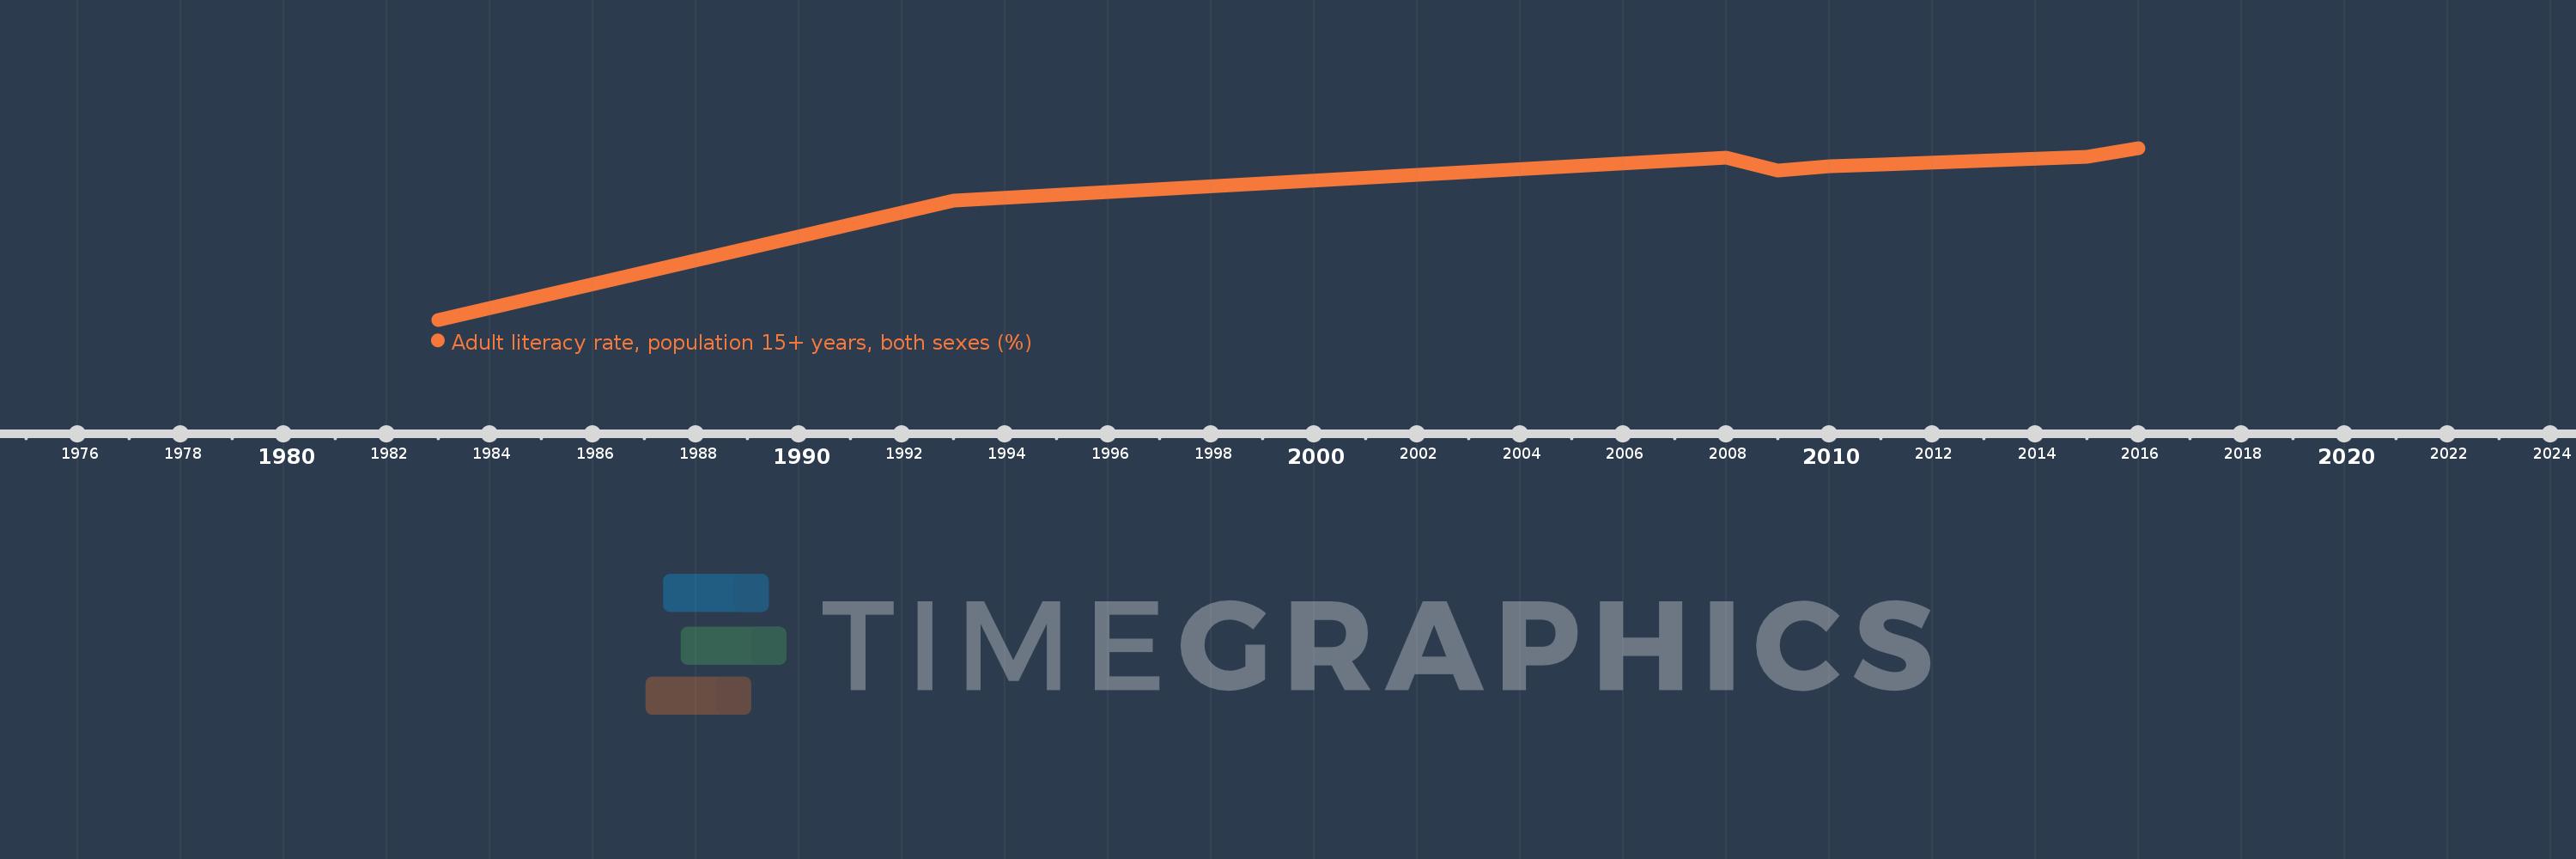
Nesta escala de tempo está apresentado um gráfico de 1983 ano até 2016 ano Paraguay. Dados de 1982 ano ausente. O número de observações reais por data: 8.

Fonte (nome):

Indicadores de desenvolvimento mundial

Fonte (organização):

UNESCO Institute for Statistics

Categorias:

Education

Foi atualizado:

23 abr 2017 ano

Indicadores de alterações dos valores ao longo dos anos

Em média:
91.795
Mínimo:
78.459
1 jan 1983 ano
Máximo:
95.536
1 jan 2016 ano
Na data de observação
Valor
Mudança absoluta
A alteração em relação ao valor anterior
1 jan 1983 ano
78.459
+78.459
0.0%
1 jan 1993 ano
90.272
+11.813
15.06%
1 jan 2008 ano
94.558
+4.286
4.75%
1 jan 2009 ano
93.292
-1.266
-1.34%
1 jan 2010 ano
93.754
+0.462
0.5%
1 jan 2011 ano
93.871
+0.117
0.12%
1 jan 2015 ano
94.617
+0.746
0.79%
1 jan 2016 ano
95.536
+0.919
0.97%

Classificação de países por estatísticas atuais por anos