33
/pt/
AIzaSyAYiBZKx7MnpbEhh9jyipgxe19OcubqV5w
August 1, 2025
156950
Iran, Islamic Rep.
IRN
true
2
1
Adult literacy rate, population 15+ years, both sexes (%)
2016,2014,2013,2009,2007,2006,2003,1997,1992,1987,1977
Download
Biblioteca de estatísticas globais →Iran, Islamic Rep. →

Adult literacy rate, population 15+ years, both sexes (%)

Estas estatísticas em outros países:

AfghanistanAlbaniaAlgeriaAmerican SamoaAngolaAntigua and BarbudaArab WorldArgentinaArmeniaArubaAzerbaijanBahrainBangladeshBarbadosBelarusBelizeBeninBhutanBoliviaBosnia and HerzegovinaBotswanaBrazilBrunei DarussalamBulgariaBurkina FasoBurundiCabo VerdeCambodiaCameroonCaribbean small statesCayman IslandsCentral African RepublicCentral Europe and the BalticsChadChileChinaColombiaComorosCongo, Dem. Rep.Congo, Rep.Costa RicaCote d'IvoireCroatiaCubaCyprusDominican RepublicEarly-demographic dividendEast Asia & PacificEast Asia & Pacific (excluding high income)East Asia & Pacific (IDA & IBRD countries)EcuadorEgypt, Arab Rep.El SalvadorEquatorial GuineaEritreaEstoniaEthiopiaEurope & Central AsiaEurope & Central Asia (excluding high income)Europe & Central Asia (IDA & IBRD countries)Fragile and conflict affected situationsGabonGambia, TheGeorgiaGhanaGreeceGrenadaGuamGuatemalaGuineaGuinea-BissauGuyanaHaitiHeavily indebted poor countries (HIPC)HondurasHungaryIBRD onlyIDA & IBRD totalIDA blendIDA onlyIDA totalIndiaIndonesiaIran, Islamic Rep.IraqIsraelItalyJamaicaJordanKazakhstanKenyaKorea, Dem. People’s Rep.Korea, Rep.KuwaitKyrgyz RepublicLao PDRLate-demographic dividendLatin America & Caribbean Latin America & Caribbean (excluding high income)Latin America & the Caribbean (IDA & IBRD countries)LatviaLeast developed countries: UN classificationLebanonLesothoLiberiaLibyaLithuaniaLow & middle incomeLow incomeLower middle incomeMacao SAR, ChinaMacedonia, FYRMadagascarMalawiMalaysiaMaldivesMaliMaltaMarshall IslandsMauritaniaMauritiusMexicoMiddle East & North AfricaMiddle East & North Africa (excluding high income)Middle East & North Africa (IDA & IBRD countries)Middle incomeMoldovaMongoliaMontenegroMoroccoMozambiqueMyanmarNamibiaNepalNew CaledoniaNicaraguaNigerNigeriaOmanOther small statesPacific island small statesPakistanPalauPanamaPapua New GuineaParaguayPeruPhilippinesPolandPortugalPre-demographic dividendPuerto RicoQatarRomaniaRussian FederationRwandaSamoaSao Tome and PrincipeSaudi ArabiaSenegalSerbiaSeychellesSierra LeoneSingaporeSloveniaSmall statesSolomon IslandsSouth AfricaSouth AsiaSouth Asia (IDA & IBRD)South SudanSpainSri LankaSt. Vincent and the GrenadinesSub-Saharan Africa Sub-Saharan Africa (excluding high income)Sub-Saharan Africa (IDA & IBRD countries)SudanSurinameSwazilandSyrian Arab RepublicTajikistanTanzaniaThailandTimor-LesteTogoTongaTrinidad and TobagoTunisiaTurkeyTurkmenistanUgandaUkraineUnited Arab EmiratesUpper middle incomeUruguayUzbekistanVanuatuVenezuela, RBVietnamWest Bank and GazaWorldYemen, Rep.ZambiaZimbabwe

Linha do tempo:

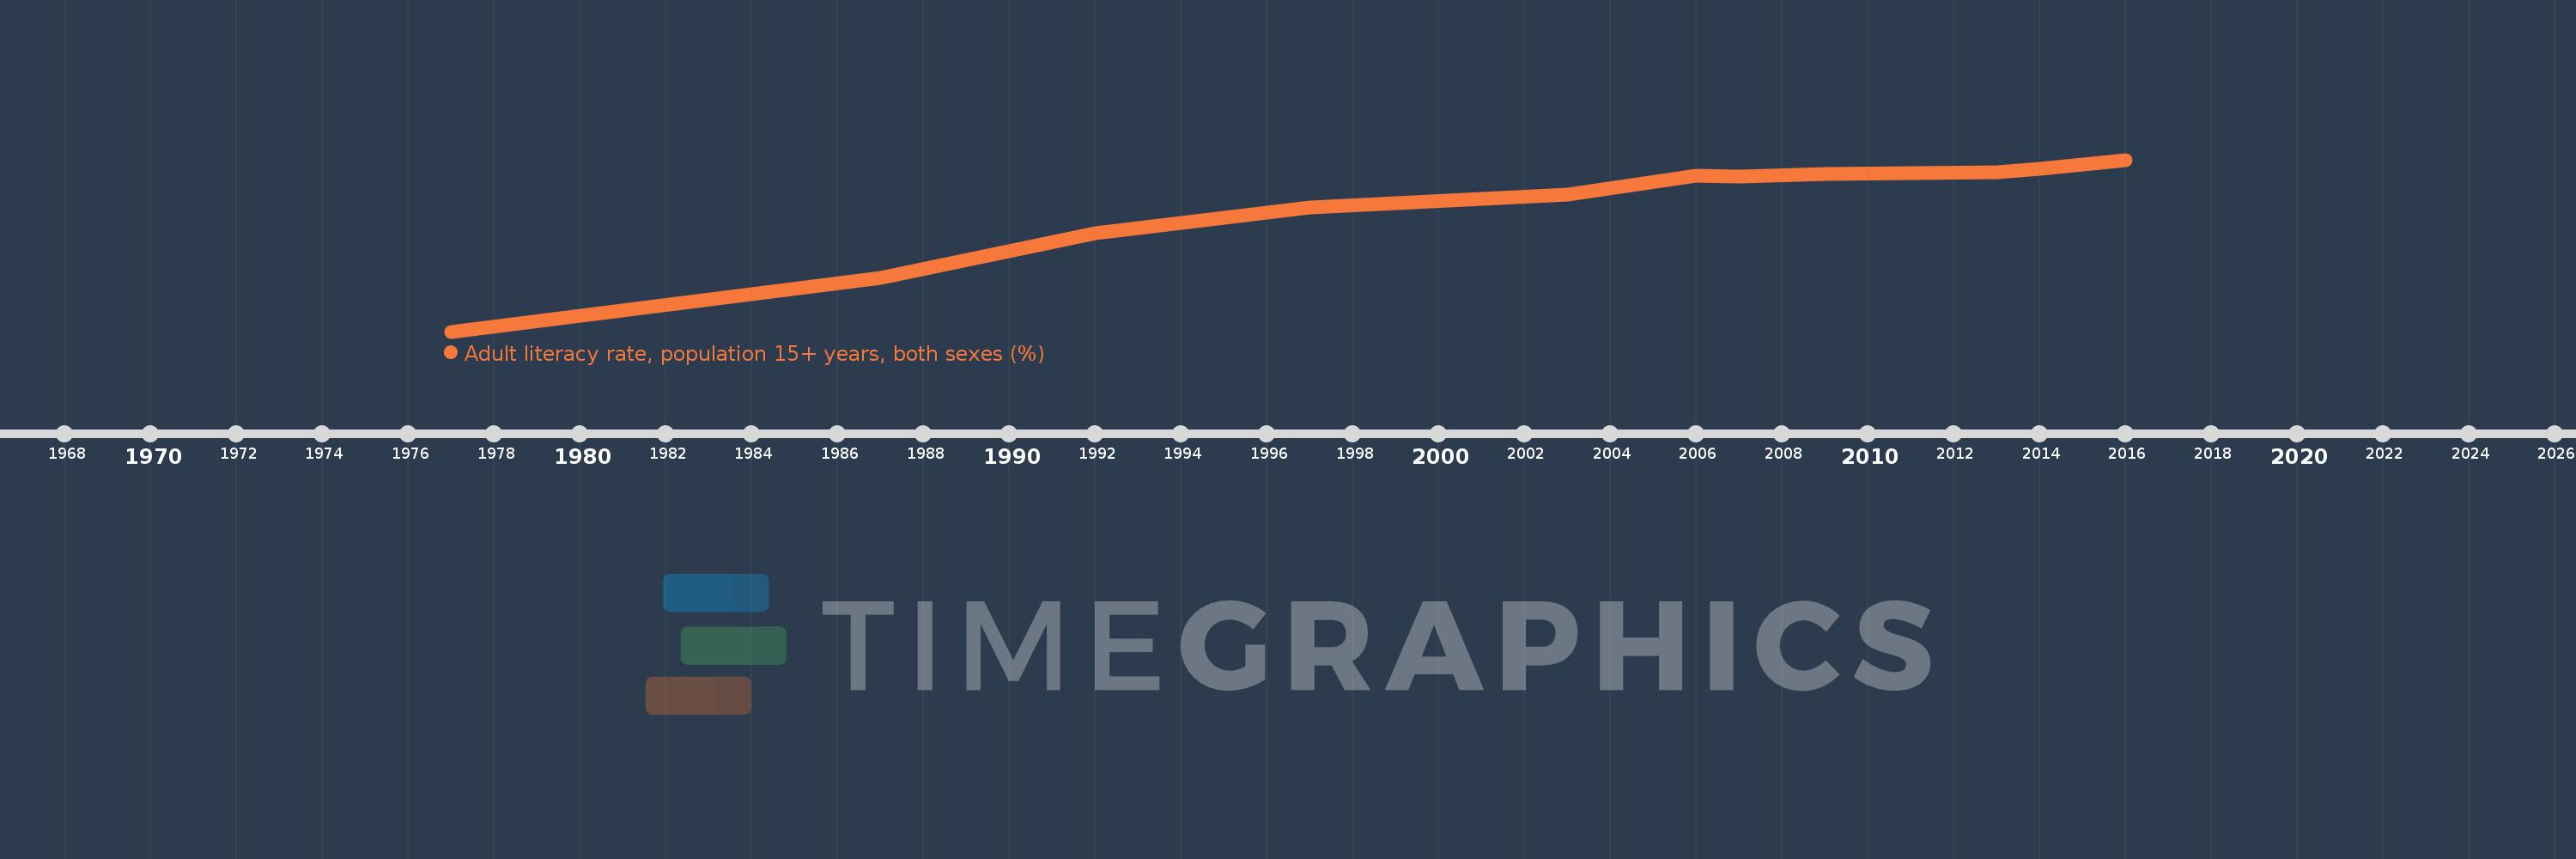
Nesta escala de tempo está apresentado um gráfico de 1977 ano até 2016 ano Iran, Islamic Rep.. Dados de 1976 ano ausente. O número de observações reais por data: 11.

Fonte (nome):

Indicadores de desenvolvimento mundial

Fonte (organização):

UNESCO Institute for Statistics

Categorias:

Education

Foi atualizado:

23 abr 2017 ano

Indicadores de alterações dos valores ao longo dos anos

Em média:
73.417
Mínimo:
36.518
1 jan 1977 ano
Máximo:
87.173
1 jan 2016 ano
Na data de observação
Valor
Mudança absoluta
A alteração em relação ao valor anterior
1 jan 1977 ano
36.518
+36.518
0.0%
1 jan 1987 ano
52.32
+15.801
43.27%
1 jan 1992 ano
65.531
+13.212
25.25%
1 jan 1997 ano
73.06
+7.529
11.49%
1 jan 2003 ano
77.0
+3.94
5.39%
1 jan 2006 ano
82.441
+5.441
7.07%
1 jan 2007 ano
82.331
-0.11
-0.13%
1 jan 2009 ano
82.962
+0.631
0.77%
1 jan 2013 ano
83.626
+0.664
0.8%
1 jan 2014 ano
84.627
+1.001
1.2%
1 jan 2016 ano
87.173
+2.546
3.01%

Classificação de países por estatísticas atuais por anos