33
/pt/
AIzaSyAYiBZKx7MnpbEhh9jyipgxe19OcubqV5w
August 1, 2025
215743
Oman
OMN
true
2
1
Progression to secondary school, male (%)
2014,2013,2012,2003,2002,2001,2000,1998,1997,1996,1995,1993,1991,1990,1989,1988,1987,1986,1985,1984,1980,1979,1977,1975
Download
Biblioteca de estatísticas globais →Oman →

Progression to secondary school, male (%)

Estas estatísticas em outros países:

AfghanistanAlbaniaAlgeriaAngolaAntigua and BarbudaArab WorldArgentinaArmeniaArubaAustriaAzerbaijanBahamas, TheBahrainBarbadosBelarusBelgiumBelizeBeninBermudaBhutanBoliviaBosnia and HerzegovinaBotswanaBrazilBritish Virgin IslandsBrunei DarussalamBulgariaBurkina FasoBurundiCabo VerdeCambodiaCameroonCaribbean small statesCayman IslandsCentral African RepublicCentral Europe and the BalticsChadChileChinaColombiaComorosCongo, Dem. Rep.Congo, Rep.Costa RicaCote d'IvoireCroatiaCubaCyprusCzech RepublicDenmarkDjiboutiDominicaDominican RepublicEarly-demographic dividendEast Asia & PacificEast Asia & Pacific (excluding high income)East Asia & Pacific (IDA & IBRD countries)EcuadorEgypt, Arab Rep.El SalvadorEquatorial GuineaEritreaEstoniaEthiopiaEuro areaEurope & Central AsiaEurope & Central Asia (excluding high income)Europe & Central Asia (IDA & IBRD countries)European UnionFijiFinlandFragile and conflict affected situationsGabonGambia, TheGeorgiaGermanyGhanaGreeceGrenadaGuatemalaGuineaGuinea-BissauGuyanaHaitiHeavily indebted poor countries (HIPC)High incomeHondurasHong Kong SAR, ChinaHungaryIBRD onlyIcelandIDA & IBRD totalIDA blendIDA onlyIDA totalIndiaIndonesiaIran, Islamic Rep.IraqIsraelItalyJamaicaJapanJordanKazakhstanKenyaKiribatiKorea, Rep.KuwaitKyrgyz RepublicLao PDRLate-demographic dividendLatin America & Caribbean Latin America & Caribbean (excluding high income)Latin America & the Caribbean (IDA & IBRD countries)LatviaLeast developed countries: UN classificationLebanonLesothoLiberiaLibyaLiechtensteinLithuaniaLow & middle incomeLow incomeLower middle incomeLuxembourgMacao SAR, ChinaMacedonia, FYRMadagascarMalawiMalaysiaMaldivesMaliMaltaMarshall IslandsMauritaniaMauritiusMexicoMiddle East & North AfricaMiddle East & North Africa (excluding high income)Middle East & North Africa (IDA & IBRD countries)Middle incomeMoldovaMonacoMongoliaMoroccoMozambiqueMyanmarNamibiaNepalNetherlandsNicaraguaNigerNorwayOECD membersOmanOther small statesPacific island small statesPakistanPalauPanamaParaguayPeruPhilippinesPolandPortugalPost-demographic dividendPre-demographic dividendQatarRomaniaRussian FederationRwandaSamoaSan MarinoSao Tome and PrincipeSaudi ArabiaSenegalSerbiaSeychellesSierra LeoneSingaporeSlovak RepublicSloveniaSmall statesSolomon IslandsSouth AfricaSouth AsiaSouth Asia (IDA & IBRD)SpainSri LankaSt. Kitts and NevisSt. LuciaSt. Vincent and the GrenadinesSub-Saharan Africa Sub-Saharan Africa (excluding high income)Sub-Saharan Africa (IDA & IBRD countries)SudanSurinameSwazilandSwedenSwitzerlandSyrian Arab RepublicTajikistanTanzaniaThailandTimor-LesteTogoTongaTrinidad and TobagoTunisiaTurkeyTurks and Caicos IslandsTuvaluUgandaUkraineUnited Arab EmiratesUpper middle incomeUruguayUzbekistanVanuatuVenezuela, RBVietnamWest Bank and GazaWorldYemen, Rep.ZambiaZimbabwe

Linha do tempo:

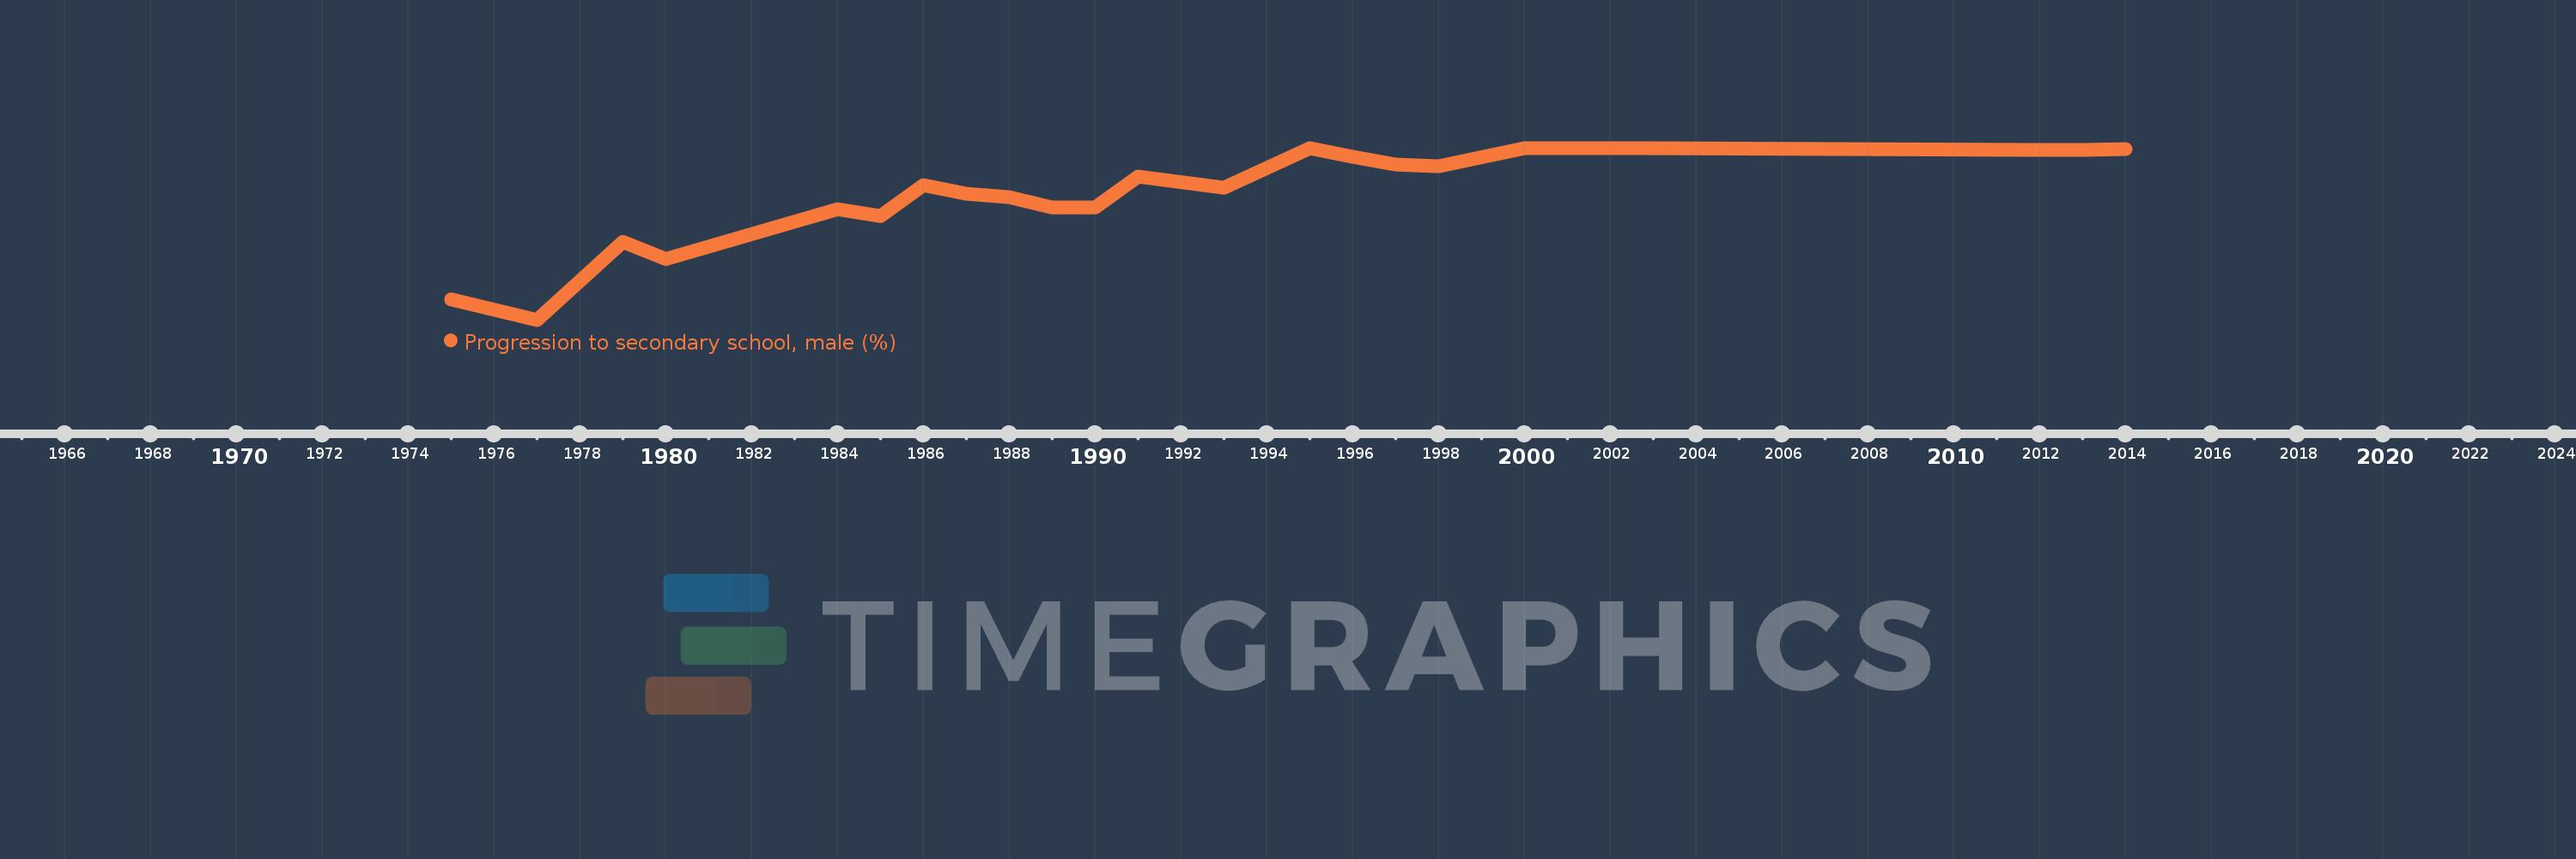
Nesta escala de tempo está apresentado um gráfico de 1975 ano até 2014 ano Oman. Dados de 1974 ano ausente. O número de observações reais por data: 24.

Fonte (nome):

Indicadores de desenvolvimento mundial

Fonte (organização):

United Nations Educational, Scientific, and Cultural Organization (UNESCO) Institute for Statistics.

Categorias:

Education, Gender

Foi atualizado:

23 abr 2017 ano

Indicadores de alterações dos valores ao longo dos anos

Em média:
85.961
Mínimo:
43.551
1 jan 1977 ano
Máximo:
100.0
1 jan 1995 ano
Na data de observação
Valor
Mudança absoluta
A alteração em relação ao valor anterior
1 jan 1975 ano
50.209
+50.209
0.0%
1 jan 1977 ano
43.551
-6.658
-13.26%
1 jan 1979 ano
69.197
+25.646
58.89%
1 jan 1980 ano
63.616
-5.581
-8.07%
1 jan 1984 ano
79.828
+16.212
25.48%
1 jan 1985 ano
77.589
-2.238
-2.8%
1 jan 1986 ano
87.749
+10.16
13.09%
1 jan 1987 ano
85.075
-2.674
-3.05%
1 jan 1988 ano
83.756
-1.319
-1.55%
1 jan 1989 ano
80.538
-3.218
-3.84%
1 jan 1990 ano
80.419
-0.119
-0.15%
1 jan 1991 ano
90.711
+10.292
12.8%
1 jan 1993 ano
86.838
-3.874
-4.27%
1 jan 1995 ano
100.0
+13.162
15.16%
1 jan 1996 ano
97.196
-2.804
-2.8%
1 jan 1997 ano
94.499
-2.697
-2.77%
1 jan 1998 ano
94.032
-0.467
-0.49%
1 jan 2000 ano
100.0
+5.968
6.35%
1 jan 2001 ano
100.0
0.0
0.0%
1 jan 2002 ano
100.0
0.0
0.0%
1 jan 2003 ano
100.0
0.0
0.0%
1 jan 2012 ano
99.287
-0.713
-0.71%
1 jan 2013 ano
99.362
+0.075
0.08%
1 jan 2014 ano
99.623
+0.261
0.26%

Classificação de países por estatísticas atuais por anos