33
/pt/
AIzaSyB4mHJ5NPEv-XzF7P6NDYXjlkCWaeKw5bc
November 1, 2025
111557
Congo, Rep.
COG
true
2
1
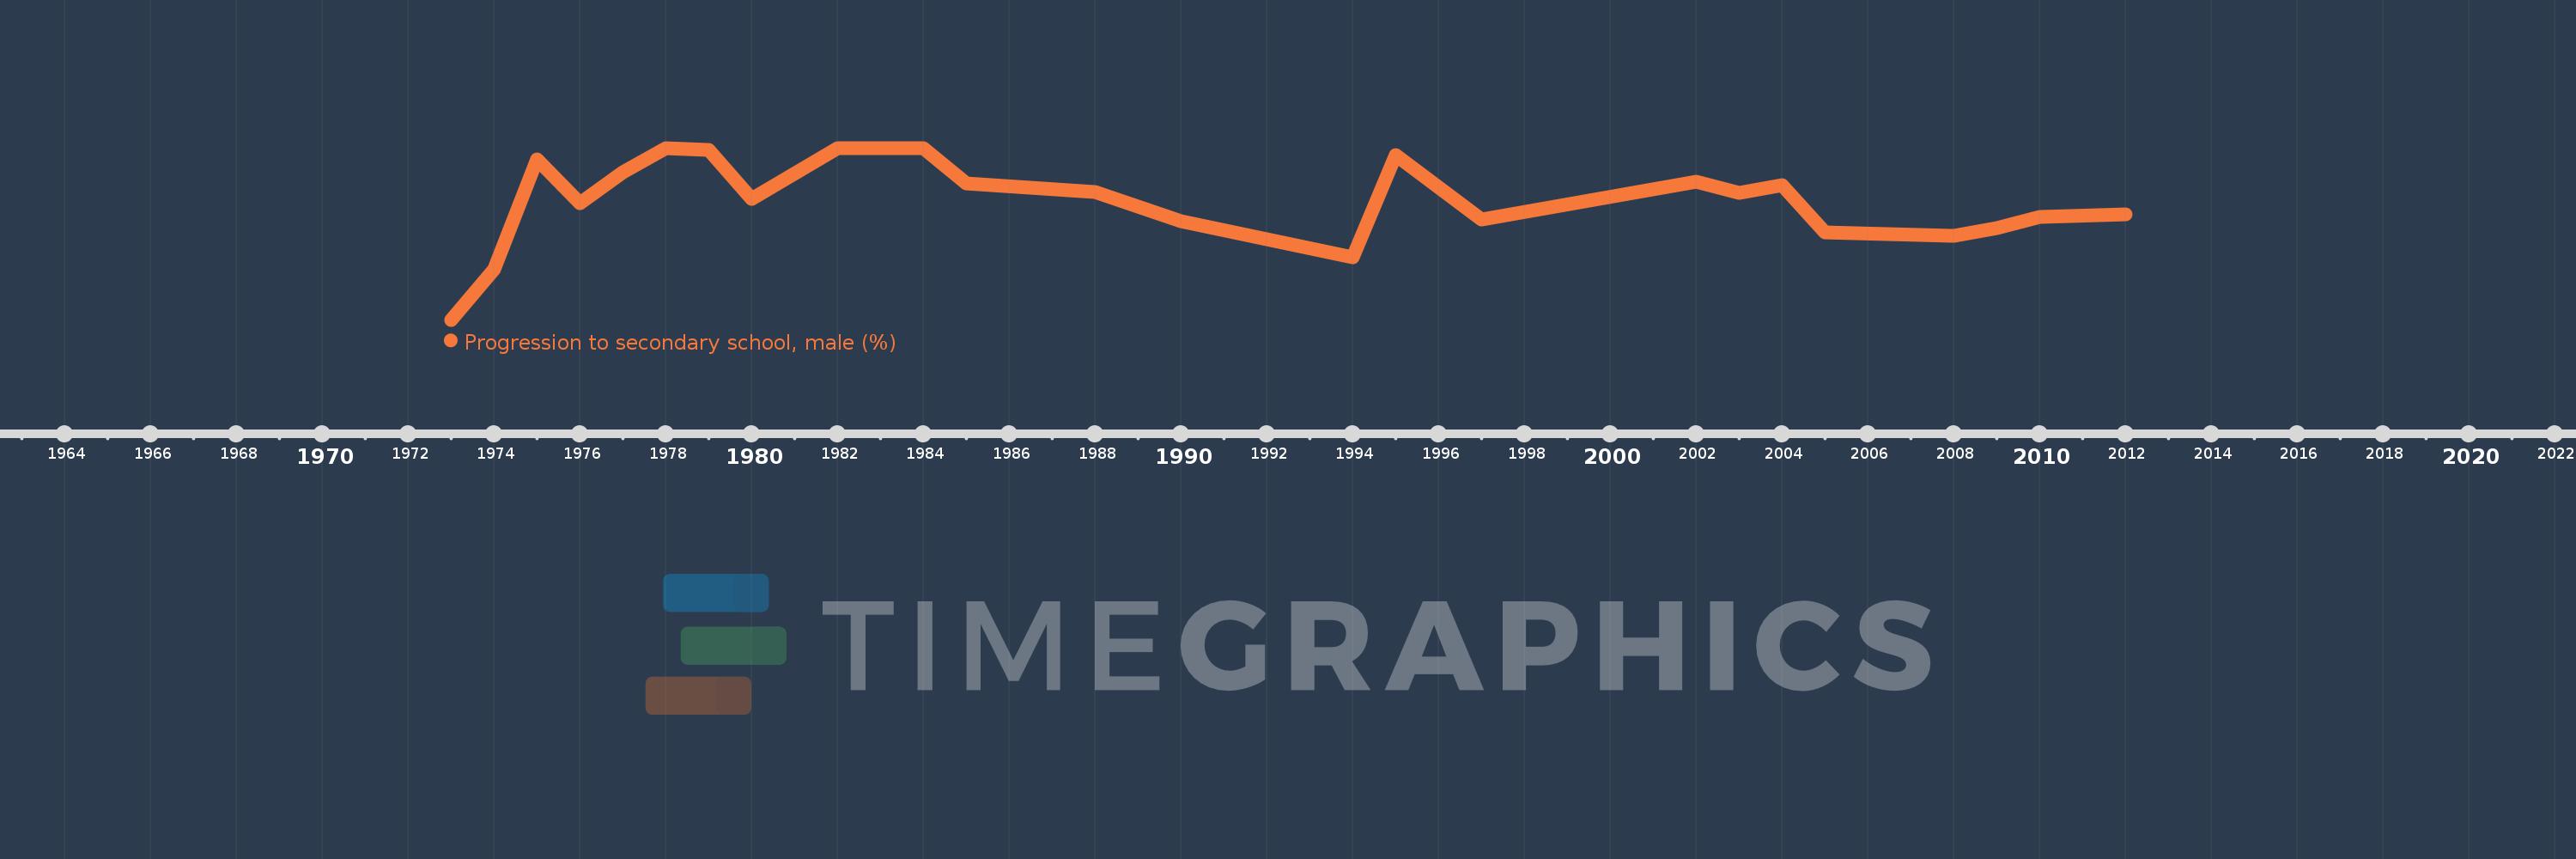
Progression to secondary school, male (%)
2012,2010,2009,2008,2005,2004,2003,2002,1997,1995,1994,1990,1988,1985,1984,1983,1982,1980,1979,1978,1977,1976,1975,1974,1973