33
/pt/
AIzaSyAYiBZKx7MnpbEhh9jyipgxe19OcubqV5w
August 1, 2025
215512
Oman
OMN
true
2
1
Market capitalization of listed domestic companies (% of GDP)
2016,2015,2014,2013,2012,2011,2010,2009,2008,2007,2006,2005,2002,2001,2000,1999,1998,1997,1996,1995,1994
Download
Biblioteca de estatísticas globais →Oman →

Market capitalization of listed domestic companies (% of GDP)

Estas estatísticas em outros países:

Arab WorldArgentinaArmeniaAustraliaAustriaAzerbaijanBahrainBangladeshBarbadosBelgiumBermudaBhutanBoliviaBosnia and HerzegovinaBotswanaBrazilBulgariaCanadaCayman IslandsCentral Europe and the BalticsChannel IslandsChileChinaColombiaCosta RicaCote d'IvoireCroatiaCyprusCzech RepublicDenmarkDominican RepublicEarly-demographic dividendEast Asia & PacificEast Asia & Pacific (excluding high income)East Asia & Pacific (IDA & IBRD countries)EcuadorEgypt, Arab Rep.El SalvadorEuro areaEurope & Central AsiaEurope & Central Asia (excluding high income)Europe & Central Asia (IDA & IBRD countries)European UnionFijiFinlandFranceGeorgiaGermanyGhanaGreeceGuyanaHigh incomeHondurasHong Kong SAR, ChinaHungaryIBRD onlyIDA & IBRD totalIDA blendIndiaIndonesiaIran, Islamic Rep.IrelandIsraelItalyJamaicaJapanJordanKazakhstanKenyaKorea, Rep.KuwaitKyrgyz RepublicLate-demographic dividendLatin America & Caribbean Latin America & Caribbean (excluding high income)Latin America & the Caribbean (IDA & IBRD countries)LebanonLow & middle incomeLower middle incomeLuxembourgMacedonia, FYRMalawiMalaysiaMaltaMauritiusMexicoMiddle East & North AfricaMiddle East & North Africa (excluding high income)Middle East & North Africa (IDA & IBRD countries)Middle incomeMoldovaMongoliaMontenegroMoroccoNamibiaNetherlandsNew ZealandNigeriaNorth AmericaNorwayOECD membersOmanPakistanPanamaPapua New GuineaParaguayPeruPhilippinesPolandPortugalPost-demographic dividendQatarRomaniaRussian FederationSaudi ArabiaSerbiaSingaporeSlovak RepublicSloveniaSouth AfricaSouth AsiaSouth Asia (IDA & IBRD)SpainSri LankaSt. Kitts and NevisSub-Saharan Africa Sub-Saharan Africa (excluding high income)Sub-Saharan Africa (IDA & IBRD countries)SwazilandSwedenSwitzerlandTanzaniaThailandTrinidad and TobagoTunisiaTurkeyUgandaUkraineUnited Arab EmiratesUnited KingdomUnited StatesUpper middle incomeUruguayUzbekistanVenezuela, RBVietnamWest Bank and GazaWorldZambiaZimbabwe

Linha do tempo:

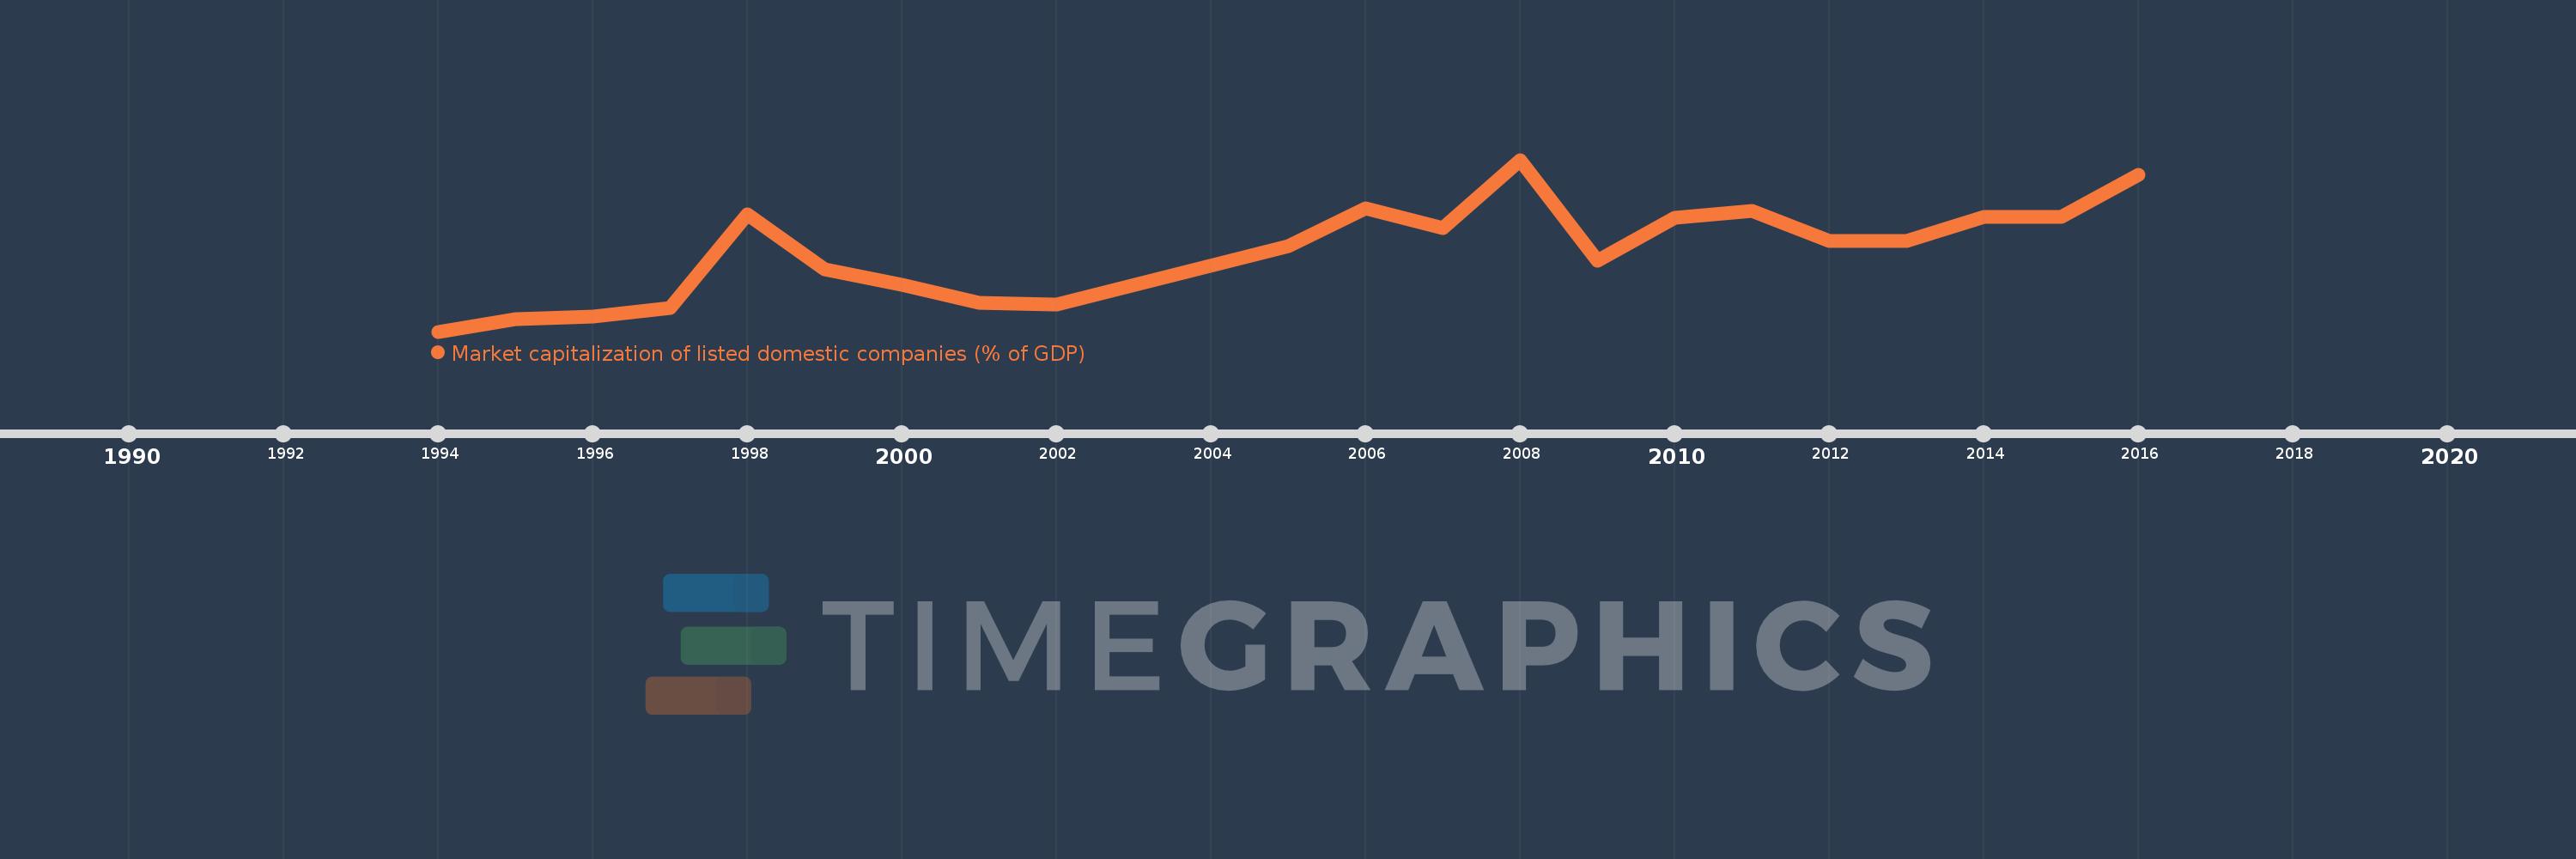
Nesta escala de tempo está apresentado um gráfico de 1994 ano até 2016 ano Oman. Dados de 1993 ano ausente. O número de observações reais por data: 21.

Fonte (nome):

Indicadores de desenvolvimento mundial

Fonte (organização):

World Federation of Exchanges database.

Categorias:

Financial Sector

Foi atualizado:

23 abr 2017 ano

Indicadores de alterações dos valores ao longo dos anos

Em média:
36.551
Mínimo:
12.898
1 jan 1994 ano
Máximo:
63.4
1 jan 2008 ano
Na data de observação
Valor
Mudança absoluta
A alteração em relação ao valor anterior
1 jan 1994 ano
12.898
+12.898
0.0%
1 jan 1995 ano
16.511
+3.613
28.02%
1 jan 1996 ano
17.233
+0.722
4.37%
1 jan 1997 ano
19.922
+2.689
15.6%
1 jan 1998 ano
47.328
+27.406
137.57%
1 jan 1999 ano
31.179
-16.149
-34.12%
1 jan 2000 ano
26.59
-4.589
-14.72%
1 jan 2001 ano
21.414
-5.176
-19.47%
1 jan 2002 ano
20.888
-0.526
-2.46%
1 jan 2005 ano
38.1
+17.212
82.4%
1 jan 2006 ano
49.125
+11.025
28.94%
1 jan 2007 ano
43.272
-5.853
-11.91%
1 jan 2008 ano
63.4
+20.129
46.52%
1 jan 2009 ano
33.805
-29.596
-46.68%
1 jan 2010 ano
46.435
+12.63
37.36%
1 jan 2011 ano
48.287
+1.852
3.99%
1 jan 2012 ano
39.541
-8.745
-18.11%
1 jan 2013 ano
39.499
-0.042
-0.11%
1 jan 2014 ano
46.576
+7.077
17.92%
1 jan 2015 ano
46.684
+0.108
0.23%
1 jan 2016 ano
58.89
+12.206
26.14%

Classificação de países por estatísticas atuais por anos