33
/pt/
AIzaSyAYiBZKx7MnpbEhh9jyipgxe19OcubqV5w
August 1, 2025
167760
Kenya
KEN
true
2
1
Market capitalization of listed domestic companies (% of GDP)
2012,2011,2010,2009,2008,2007,2006,2005,2004,2003,2002,2001,1999,1998,1997,1996,1995,1994
Download
Biblioteca de estatísticas globais →Kenya →

Market capitalization of listed domestic companies (% of GDP)

Estas estatísticas em outros países:

Arab WorldArgentinaArmeniaAustraliaAustriaAzerbaijanBahrainBangladeshBarbadosBelgiumBermudaBhutanBoliviaBosnia and HerzegovinaBotswanaBrazilBulgariaCanadaCayman IslandsCentral Europe and the BalticsChannel IslandsChileChinaColombiaCosta RicaCote d'IvoireCroatiaCyprusCzech RepublicDenmarkDominican RepublicEarly-demographic dividendEast Asia & PacificEast Asia & Pacific (excluding high income)East Asia & Pacific (IDA & IBRD countries)EcuadorEgypt, Arab Rep.El SalvadorEuro areaEurope & Central AsiaEurope & Central Asia (excluding high income)Europe & Central Asia (IDA & IBRD countries)European UnionFijiFinlandFranceGeorgiaGermanyGhanaGreeceGuyanaHigh incomeHondurasHong Kong SAR, ChinaHungaryIBRD onlyIDA & IBRD totalIDA blendIndiaIndonesiaIran, Islamic Rep.IrelandIsraelItalyJamaicaJapanJordanKazakhstanKenyaKorea, Rep.KuwaitKyrgyz RepublicLate-demographic dividendLatin America & Caribbean Latin America & Caribbean (excluding high income)Latin America & the Caribbean (IDA & IBRD countries)LebanonLow & middle incomeLower middle incomeLuxembourgMacedonia, FYRMalawiMalaysiaMaltaMauritiusMexicoMiddle East & North AfricaMiddle East & North Africa (excluding high income)Middle East & North Africa (IDA & IBRD countries)Middle incomeMoldovaMongoliaMontenegroMoroccoNamibiaNetherlandsNew ZealandNigeriaNorth AmericaNorwayOECD membersOmanPakistanPanamaPapua New GuineaParaguayPeruPhilippinesPolandPortugalPost-demographic dividendQatarRomaniaRussian FederationSaudi ArabiaSerbiaSingaporeSlovak RepublicSloveniaSouth AfricaSouth AsiaSouth Asia (IDA & IBRD)SpainSri LankaSt. Kitts and NevisSub-Saharan Africa Sub-Saharan Africa (excluding high income)Sub-Saharan Africa (IDA & IBRD countries)SwazilandSwedenSwitzerlandTanzaniaThailandTrinidad and TobagoTunisiaTurkeyUgandaUkraineUnited Arab EmiratesUnited KingdomUnited StatesUpper middle incomeUruguayUzbekistanVenezuela, RBVietnamWest Bank and GazaWorldZambiaZimbabwe

Linha do tempo:

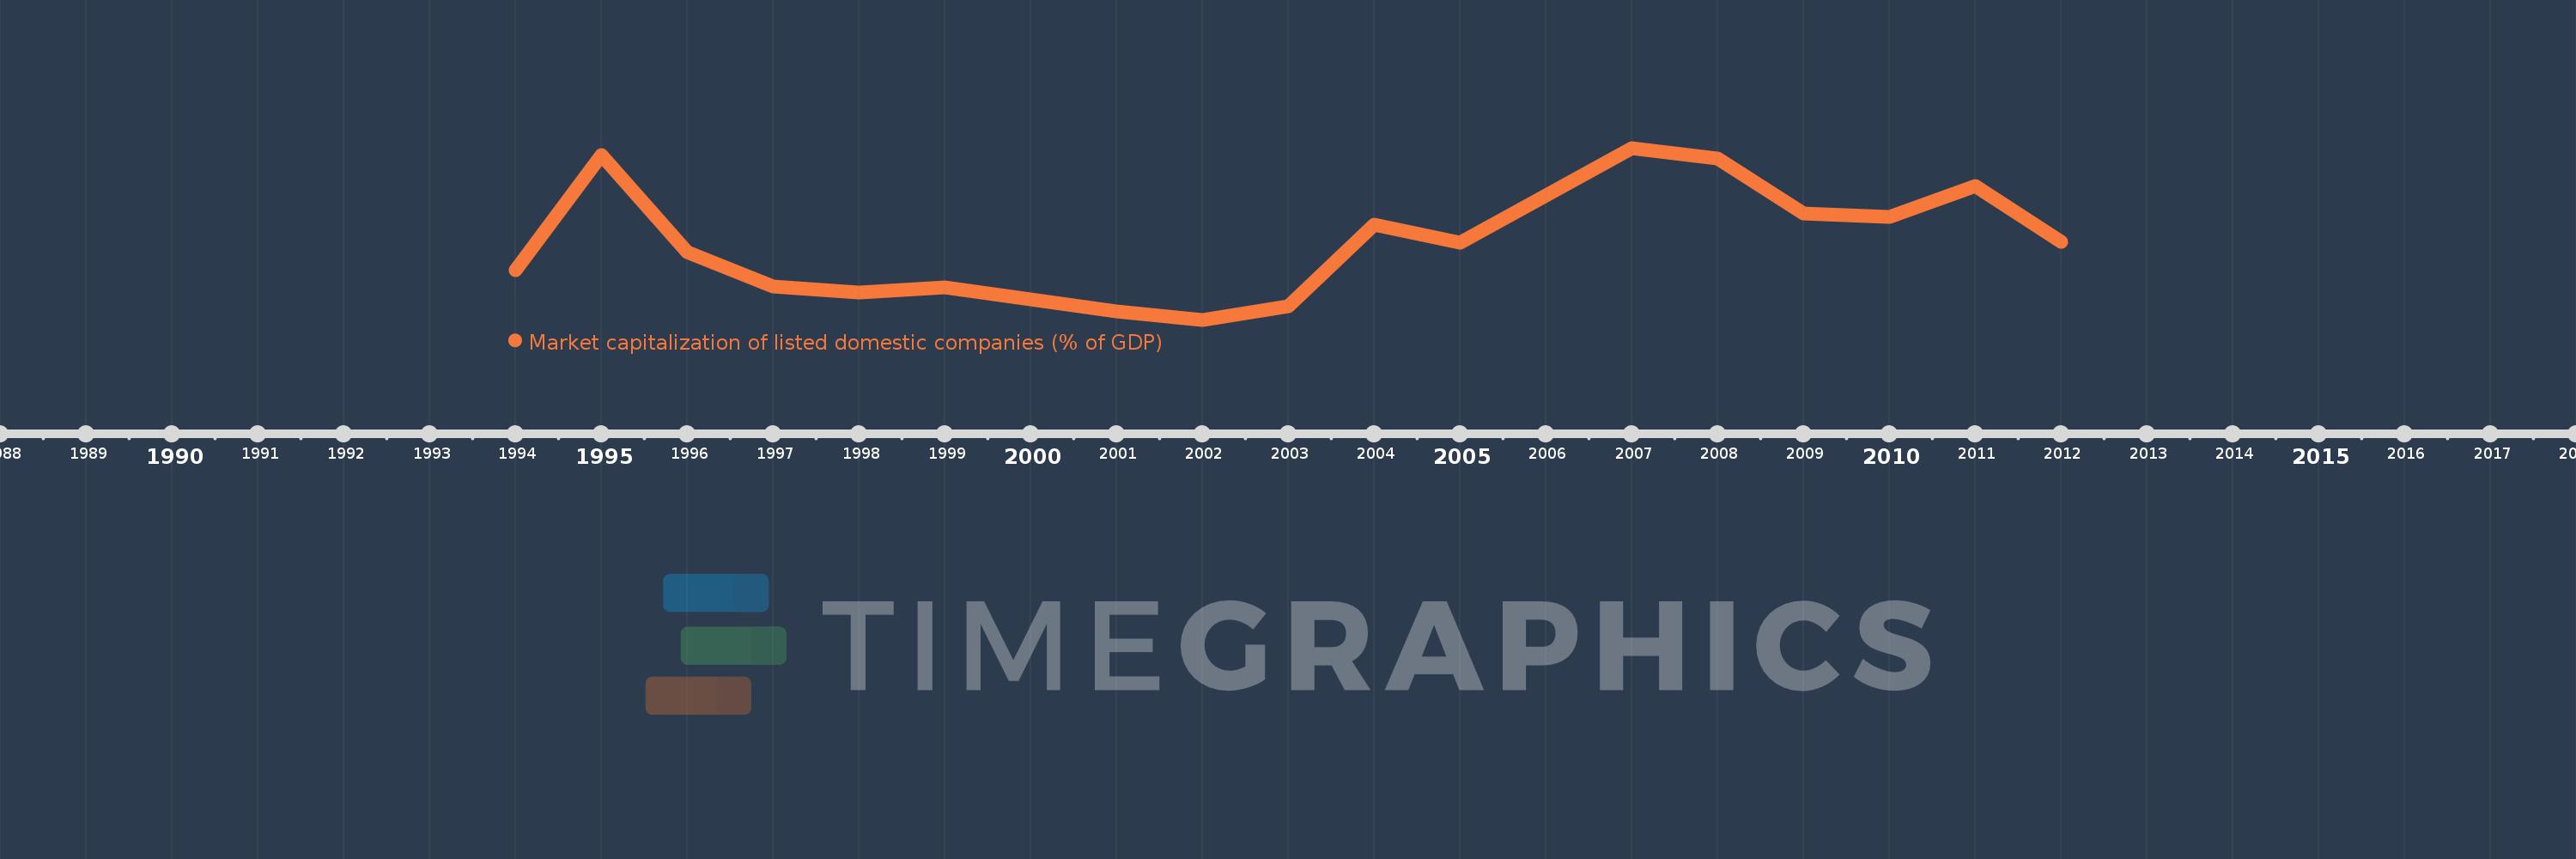
Nesta escala de tempo está apresentado um gráfico de 1994 ano até 2012 ano Kenya. Dados de 1993 ano ausente. O número de observações reais por data: 18.

Fonte (nome):

Indicadores de desenvolvimento mundial

Fonte (organização):

World Federation of Exchanges database.

Categorias:

Financial Sector

Foi atualizado:

23 abr 2017 ano

Indicadores de alterações dos valores ao longo dos anos

Em média:
24.903
Mínimo:
8.049
1 jan 2002 ano
Máximo:
44.057
1 jan 2007 ano
Na data de observação
Valor
Mudança absoluta
A alteração em relação ao valor anterior
1 jan 1994 ano
18.483
+18.483
0.0%
1 jan 1995 ano
42.622
+24.139
130.6%
1 jan 1996 ano
22.302
-20.32
-47.68%
1 jan 1997 ano
14.935
-7.367
-33.03%
1 jan 1998 ano
13.823
-1.112
-7.44%
1 jan 1999 ano
14.819
+0.996
7.2%
1 jan 2001 ano
9.881
-4.938
-33.32%
1 jan 2002 ano
8.049
-1.831
-18.53%
1 jan 2003 ano
10.886
+2.837
35.24%
1 jan 2004 ano
28.064
+17.178
157.79%
1 jan 2005 ano
24.175
-3.889
-13.86%
1 jan 2006 ano
34.07
+9.895
40.93%
1 jan 2007 ano
44.057
+9.987
29.31%
1 jan 2008 ano
41.756
-2.301
-5.22%
1 jan 2009 ano
30.238
-11.518
-27.58%
1 jan 2010 ano
29.623
-0.616
-2.04%
1 jan 2011 ano
36.152
+6.53
22.04%
1 jan 2012 ano
24.319
-11.834
-32.73%

Classificação de países por estatísticas atuais por anos