33
/pt/
AIzaSyAYiBZKx7MnpbEhh9jyipgxe19OcubqV5w
August 1, 2025
193097
Mauritania
MRT
true
2
1
Gross savings (% of GDP)
2015,2014,2013,1999,1998,1997,1996,1995,1994,1993,1992,1991,1990,1989,1988,1987,1986,1985,1984,1983,1982,1981,1980,1979,1978,1977,1976
Download
Biblioteca de estatísticas globais →Mauritania →

Gross savings (% of GDP)

Estas estatísticas em outros países:

AfghanistanAlbaniaAlgeriaAngolaAntigua and BarbudaArab WorldArgentinaArmeniaAustraliaAustriaAzerbaijanBahamas, TheBahrainBangladeshBarbadosBelarusBelgiumBelizeBeninBermudaBhutanBoliviaBosnia and HerzegovinaBotswanaBrazilBrunei DarussalamBulgariaBurkina FasoBurundiCabo VerdeCambodiaCameroonCanadaCaribbean small statesCentral African RepublicCentral Europe and the BalticsChadChileChinaColombiaComorosCongo, Dem. Rep.Congo, Rep.Costa RicaCote d'IvoireCroatiaCyprusCzech RepublicDenmarkDjiboutiDominicaDominican RepublicEarly-demographic dividendEast Asia & PacificEast Asia & Pacific (excluding high income)East Asia & Pacific (IDA & IBRD countries)EcuadorEgypt, Arab Rep.El SalvadorEquatorial GuineaEritreaEstoniaEthiopiaEuro areaEurope & Central AsiaEurope & Central Asia (excluding high income)Europe & Central Asia (IDA & IBRD countries)European UnionFaroe IslandsFijiFinlandFragile and conflict affected situationsFranceGabonGambia, TheGeorgiaGermanyGhanaGreeceGrenadaGuatemalaGuineaGuinea-BissauGuyanaHaitiHeavily indebted poor countries (HIPC)High incomeHondurasHong Kong SAR, ChinaHungaryIBRD onlyIcelandIDA & IBRD totalIDA blendIDA onlyIDA totalIndiaIndonesiaIran, Islamic Rep.IraqIrelandIsraelItalyJamaicaJapanJordanKazakhstanKenyaKiribatiKorea, Rep.KosovoKuwaitKyrgyz RepublicLao PDRLate-demographic dividendLatin America & Caribbean Latin America & Caribbean (excluding high income)Latin America & the Caribbean (IDA & IBRD countries)LatviaLeast developed countries: UN classificationLebanonLesothoLiberiaLibyaLithuaniaLow & middle incomeLow incomeLower middle incomeLuxembourgMacao SAR, ChinaMacedonia, FYRMadagascarMalawiMalaysiaMaldivesMaliMaltaMauritaniaMauritiusMexicoMiddle East & North AfricaMiddle East & North Africa (excluding high income)Middle East & North Africa (IDA & IBRD countries)Middle incomeMoldovaMongoliaMontenegroMoroccoMozambiqueNamibiaNepalNetherlandsNew ZealandNicaraguaNigerNigeriaNorth AmericaNorwayOECD membersOmanOther small statesPacific island small statesPakistanPanamaPapua New GuineaParaguayPeruPhilippinesPolandPortugalPost-demographic dividendPre-demographic dividendQatarRomaniaRussian FederationRwandaSaudi ArabiaSenegalSerbiaSeychellesSierra LeoneSingaporeSlovak RepublicSloveniaSmall statesSolomon IslandsSouth AfricaSouth AsiaSouth Asia (IDA & IBRD)South SudanSpainSri LankaSt. Kitts and NevisSt. LuciaSt. Vincent and the GrenadinesSub-Saharan Africa Sub-Saharan Africa (excluding high income)Sub-Saharan Africa (IDA & IBRD countries)SudanSurinameSwazilandSwedenSwitzerlandSyrian Arab RepublicTajikistanTanzaniaThailandTimor-LesteTogoTongaTrinidad and TobagoTunisiaTurkeyUgandaUkraineUnited KingdomUnited StatesUpper middle incomeUruguayVanuatuVenezuela, RBVietnamWest Bank and GazaWorldYemen, Rep.ZambiaZimbabwe

Linha do tempo:

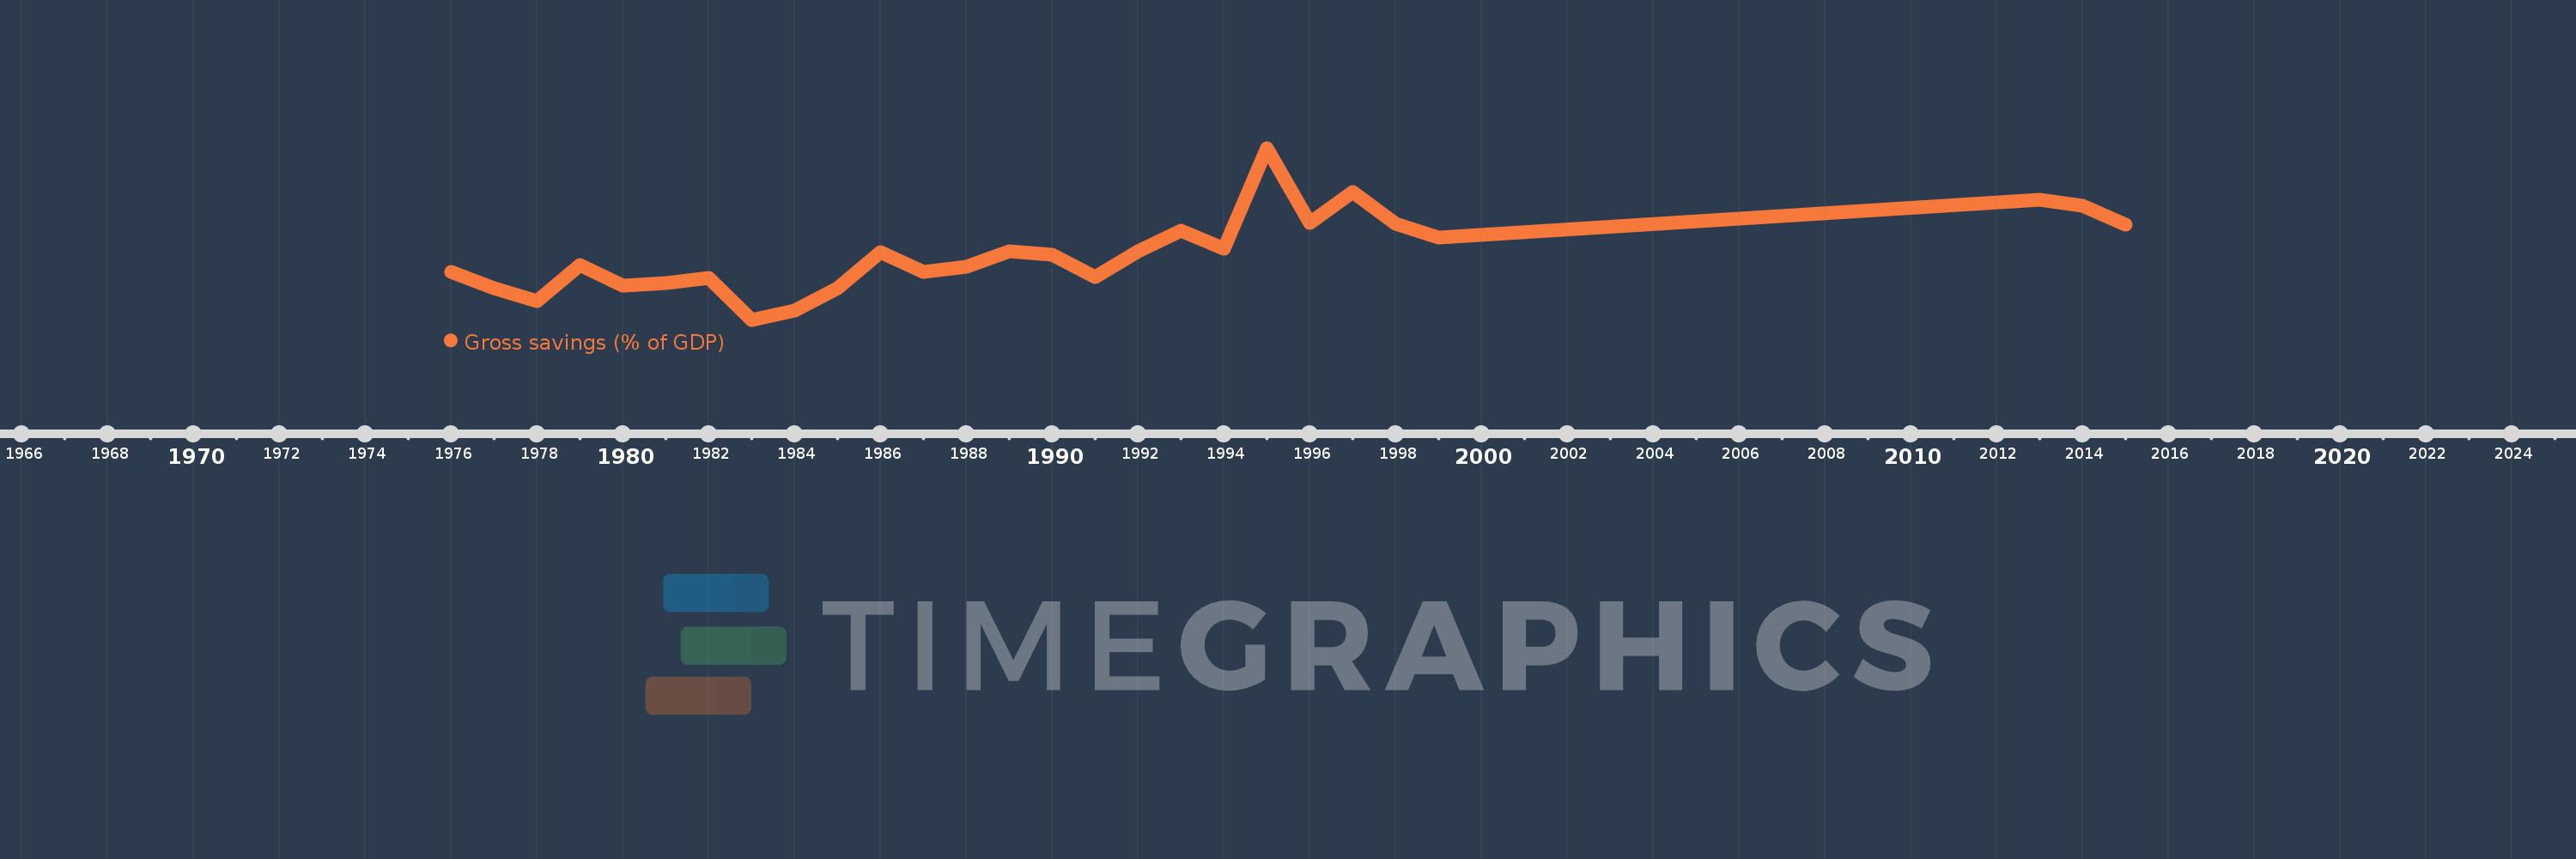
Nesta escala de tempo está apresentado um gráfico de 1976 ano até 2015 ano Mauritania. Dados de 1975 ano ausente. O número de observações reais por data: 27.

Fonte (nome):

Indicadores de desenvolvimento mundial

Fonte (organização):

World Bank national accounts data, and OECD National Accounts data files.

Categorias:

Economy & Growth

Foi atualizado:

23 abr 2017 ano

Indicadores de alterações dos valores ao longo dos anos

Em média:
15.639
Mínimo:
-7.724
1 jan 1983 ano
Máximo:
53.091
1 jan 1995 ano
Na data de observação
Valor
Mudança absoluta
A alteração em relação ao valor anterior
1 jan 1976 ano
9.189
+9.189
0.0%
1 jan 1977 ano
3.341
-5.848
-63.64%
1 jan 1978 ano
-0.996
-4.337
-129.81%
1 jan 1979 ano
11.528
+12.524
-1.26 mil%
1 jan 1980 ano
4.284
-7.244
-62.84%
1 jan 1981 ano
5.348
+1.065
24.85%
1 jan 1982 ano
6.997
+1.649
30.83%
1 jan 1983 ano
-7.724
-14.721
-210.38%
1 jan 1984 ano
-4.581
+3.143
-40.69%
1 jan 1985 ano
3.414
+7.995
-174.54%
1 jan 1986 ano
16.19
+12.775
374.16%
1 jan 1987 ano
9.309
-6.88
-42.5%
1 jan 1988 ano
10.943
+1.634
17.55%
1 jan 1989 ano
16.36
+5.417
49.5%
1 jan 1990 ano
15.251
-1.109
-6.78%
1 jan 1991 ano
7.51
-7.741
-50.76%
1 jan 1992 ano
16.466
+8.956
119.25%
1 jan 1993 ano
23.918
+7.452
45.26%
1 jan 1994 ano
17.531
-6.387
-26.7%
1 jan 1995 ano
53.091
+35.56
202.84%
1 jan 1996 ano
26.571
-26.521
-49.95%
1 jan 1997 ano
37.405
+10.835
40.78%
1 jan 1998 ano
26.277
-11.128
-29.75%
1 jan 1999 ano
21.348
-4.929
-18.76%
1 jan 2013 ano
34.682
+13.333
62.45%
1 jan 2014 ano
32.7
-1.981
-5.71%
1 jan 2015 ano
25.891
-6.809
-20.82%

Classificação de países por estatísticas atuais por anos