33
/pt/
AIzaSyAYiBZKx7MnpbEhh9jyipgxe19OcubqV5w
August 1, 2025
135594
Gabon
GAB
true
2
1
Gross savings (% of GDP)
2006,2005,2004,2003,2002,2001,2000,1999,1998,1997,1996,1995,1994,1993,1992,1991,1990,1989,1988,1987,1986,1985,1984,1983,1982,1981,1980,1979
Download
Biblioteca de estatísticas globais →Gabon →

Gross savings (% of GDP)

Estas estatísticas em outros países:

AfghanistanAlbaniaAlgeriaAngolaAntigua and BarbudaArab WorldArgentinaArmeniaAustraliaAustriaAzerbaijanBahamas, TheBahrainBangladeshBarbadosBelarusBelgiumBelizeBeninBermudaBhutanBoliviaBosnia and HerzegovinaBotswanaBrazilBrunei DarussalamBulgariaBurkina FasoBurundiCabo VerdeCambodiaCameroonCanadaCaribbean small statesCentral African RepublicCentral Europe and the BalticsChadChileChinaColombiaComorosCongo, Dem. Rep.Congo, Rep.Costa RicaCote d'IvoireCroatiaCyprusCzech RepublicDenmarkDjiboutiDominicaDominican RepublicEarly-demographic dividendEast Asia & PacificEast Asia & Pacific (excluding high income)East Asia & Pacific (IDA & IBRD countries)EcuadorEgypt, Arab Rep.El SalvadorEquatorial GuineaEritreaEstoniaEthiopiaEuro areaEurope & Central AsiaEurope & Central Asia (excluding high income)Europe & Central Asia (IDA & IBRD countries)European UnionFaroe IslandsFijiFinlandFragile and conflict affected situationsFranceGabonGambia, TheGeorgiaGermanyGhanaGreeceGrenadaGuatemalaGuineaGuinea-BissauGuyanaHaitiHeavily indebted poor countries (HIPC)High incomeHondurasHong Kong SAR, ChinaHungaryIBRD onlyIcelandIDA & IBRD totalIDA blendIDA onlyIDA totalIndiaIndonesiaIran, Islamic Rep.IraqIrelandIsraelItalyJamaicaJapanJordanKazakhstanKenyaKiribatiKorea, Rep.KosovoKuwaitKyrgyz RepublicLao PDRLate-demographic dividendLatin America & Caribbean Latin America & Caribbean (excluding high income)Latin America & the Caribbean (IDA & IBRD countries)LatviaLeast developed countries: UN classificationLebanonLesothoLiberiaLibyaLithuaniaLow & middle incomeLow incomeLower middle incomeLuxembourgMacao SAR, ChinaMacedonia, FYRMadagascarMalawiMalaysiaMaldivesMaliMaltaMauritaniaMauritiusMexicoMiddle East & North AfricaMiddle East & North Africa (excluding high income)Middle East & North Africa (IDA & IBRD countries)Middle incomeMoldovaMongoliaMontenegroMoroccoMozambiqueNamibiaNepalNetherlandsNew ZealandNicaraguaNigerNigeriaNorth AmericaNorwayOECD membersOmanOther small statesPacific island small statesPakistanPanamaPapua New GuineaParaguayPeruPhilippinesPolandPortugalPost-demographic dividendPre-demographic dividendQatarRomaniaRussian FederationRwandaSaudi ArabiaSenegalSerbiaSeychellesSierra LeoneSingaporeSlovak RepublicSloveniaSmall statesSolomon IslandsSouth AfricaSouth AsiaSouth Asia (IDA & IBRD)South SudanSpainSri LankaSt. Kitts and NevisSt. LuciaSt. Vincent and the GrenadinesSub-Saharan Africa Sub-Saharan Africa (excluding high income)Sub-Saharan Africa (IDA & IBRD countries)SudanSurinameSwazilandSwedenSwitzerlandSyrian Arab RepublicTajikistanTanzaniaThailandTimor-LesteTogoTongaTrinidad and TobagoTunisiaTurkeyUgandaUkraineUnited KingdomUnited StatesUpper middle incomeUruguayVanuatuVenezuela, RBVietnamWest Bank and GazaWorldYemen, Rep.ZambiaZimbabwe

Linha do tempo:

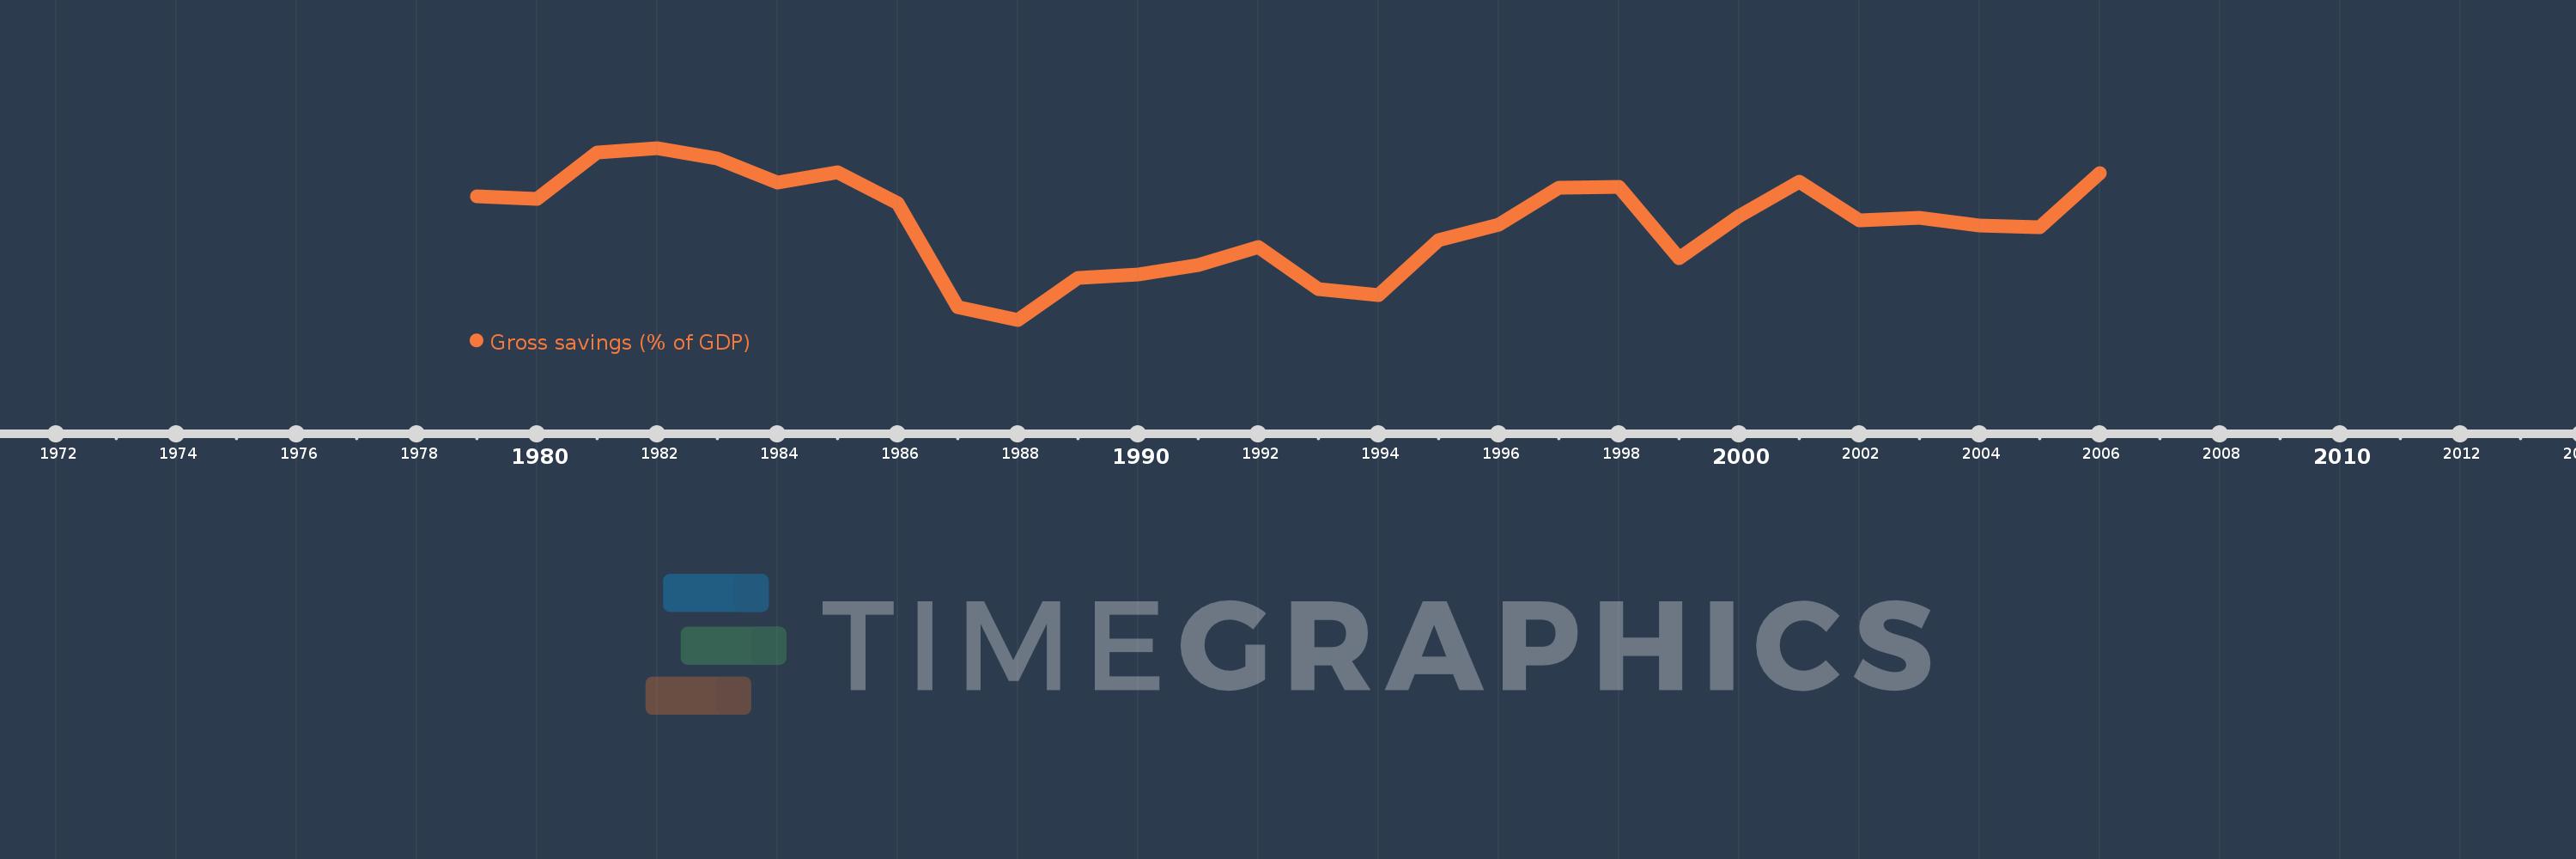
Nesta escala de tempo está apresentado um gráfico de 1979 ano até 2006 ano Gabon. Dados de 1978 ano ausente. O número de observações reais por data: 28.

Fonte (nome):

Indicadores de desenvolvimento mundial

Fonte (organização):

World Bank national accounts data, and OECD National Accounts data files.

Categorias:

Economy & Growth

Foi atualizado:

23 abr 2017 ano

Indicadores de alterações dos valores ao longo dos anos

Em média:
33.01
Mínimo:
12.676
1 jan 1988 ano
Máximo:
48.842
1 jan 1982 ano
Na data de observação
Valor
Mudança absoluta
A alteração em relação ao valor anterior
1 jan 1979 ano
38.585
+38.585
0.0%
1 jan 1980 ano
38.18
-0.405
-1.05%
1 jan 1981 ano
47.831
+9.651
25.28%
1 jan 1982 ano
48.842
+1.011
2.11%
1 jan 1983 ano
46.652
-2.191
-4.49%
1 jan 1984 ano
41.631
-5.02
-10.76%
1 jan 1985 ano
43.681
+2.05
4.92%
1 jan 1986 ano
37.127
-6.554
-15.01%
1 jan 1987 ano
15.292
-21.835
-58.81%
1 jan 1988 ano
12.676
-2.617
-17.11%
1 jan 1989 ano
21.411
+8.735
68.91%
1 jan 1990 ano
22.293
+0.882
4.12%
1 jan 1991 ano
24.252
+1.959
8.79%
1 jan 1992 ano
27.994
+3.742
15.43%
1 jan 1993 ano
19.149
-8.845
-31.6%
1 jan 1994 ano
17.84
-1.31
-6.84%
1 jan 1995 ano
29.446
+11.606
65.06%
1 jan 1996 ano
32.671
+3.225
10.95%
1 jan 1997 ano
40.455
+7.785
23.83%
1 jan 1998 ano
40.736
+0.281
0.69%
1 jan 1999 ano
25.714
-15.022
-36.88%
1 jan 2000 ano
34.541
+8.826
34.32%
1 jan 2001 ano
41.654
+7.113
20.59%
1 jan 2002 ano
33.561
-8.093
-19.43%
1 jan 2003 ano
34.081
+0.52
1.55%
1 jan 2004 ano
32.434
-1.647
-4.83%
1 jan 2005 ano
32.079
-0.355
-1.09%
1 jan 2006 ano
43.47
+11.391
35.51%

Classificação de países por estatísticas atuais por anos