30
/pt/
AIzaSyAYiBZKx7MnpbEhh9jyipgxe19OcubqV5w
April 1, 2024
183855
Macedonia, FYR
MKD
true
2
1
Fuel imports (% of merchandise imports)
2016,2015,2014,2013,2012,2011,2010,2009,2008,2007,2006,2005,2004,2003,2002,2001,2000,1999,1998,1997,1996,1995
Download
Biblioteca de estatísticas globais →Macedonia, FYR →

Fuel imports (% of merchandise imports)

Estas estatísticas em outros países:

AfghanistanAlbaniaAlgeriaAndorraAngolaAntigua and BarbudaArab WorldArgentinaArmeniaArubaAustraliaAustriaAzerbaijanBahamas, TheBahrainBangladeshBarbadosBelarusBelgiumBelizeBeninBermudaBhutanBoliviaBosnia and HerzegovinaBotswanaBrazilBrunei DarussalamBulgariaBurkina FasoBurundiCabo VerdeCambodiaCameroonCanadaCaribbean small statesCayman IslandsCentral African RepublicCentral Europe and the BalticsChadChileChinaColombiaComorosCongo, Dem. Rep.Congo, Rep.Costa RicaCote d'IvoireCroatiaCubaCyprusCzech RepublicDenmarkDjiboutiDominicaDominican RepublicEarly-demographic dividendEast Asia & PacificEast Asia & Pacific (excluding high income)East Asia & Pacific (IDA & IBRD countries)EcuadorEgypt, Arab Rep.El SalvadorEquatorial GuineaEritreaEstoniaEthiopiaEuro areaEurope & Central AsiaEurope & Central Asia (excluding high income)Europe & Central Asia (IDA & IBRD countries)European UnionFaroe IslandsFijiFinlandFragile and conflict affected situationsFranceFrench PolynesiaGabonGambia, TheGeorgiaGermanyGhanaGreeceGreenlandGrenadaGuatemalaGuineaGuinea-BissauGuyanaHaitiHeavily indebted poor countries (HIPC)High incomeHondurasHong Kong SAR, ChinaHungaryIBRD onlyIcelandIDA & IBRD totalIDA blendIDA onlyIDA totalIndiaIndonesiaIran, Islamic Rep.IraqIrelandIsraelItalyJamaicaJapanJordanKazakhstanKenyaKiribatiKorea, Rep.KuwaitKyrgyz RepublicLao PDRLate-demographic dividendLatin America & Caribbean Latin America & Caribbean (excluding high income)Latin America & the Caribbean (IDA & IBRD countries)LatviaLeast developed countries: UN classificationLebanonLesothoLiberiaLibyaLithuaniaLow & middle incomeLow incomeLower middle incomeLuxembourgMacao SAR, ChinaMacedonia, FYRMadagascarMalawiMalaysiaMaldivesMaliMaltaMauritaniaMauritiusMexicoMiddle East & North AfricaMiddle East & North Africa (excluding high income)Middle East & North Africa (IDA & IBRD countries)Middle incomeMoldovaMongoliaMoroccoMozambiqueMyanmarNamibiaNepalNetherlandsNew CaledoniaNew ZealandNicaraguaNigerNigeriaNorth AmericaNorwayOECD membersOmanOther small statesPacific island small statesPakistanPalauPanamaPapua New GuineaParaguayPeruPhilippinesPolandPortugalPost-demographic dividendPre-demographic dividendQatarRomaniaRussian FederationRwandaSamoaSao Tome and PrincipeSaudi ArabiaSenegalSerbiaSeychellesSierra LeoneSingaporeSlovak RepublicSloveniaSmall statesSolomon IslandsSomaliaSouth AfricaSouth AsiaSouth Asia (IDA & IBRD)SpainSri LankaSt. Kitts and NevisSt. LuciaSt. Vincent and the GrenadinesSub-Saharan Africa Sub-Saharan Africa (excluding high income)Sub-Saharan Africa (IDA & IBRD countries)SudanSurinameSwazilandSwedenSwitzerlandSyrian Arab RepublicTajikistanTanzaniaThailandTimor-LesteTogoTongaTrinidad and TobagoTunisiaTurkeyTurkmenistanTurks and Caicos IslandsTuvaluUgandaUkraineUnited Arab EmiratesUnited KingdomUnited StatesUpper middle incomeUruguayVanuatuVenezuela, RBVietnamVirgin Islands (U.S.)WorldYemen, Rep.ZambiaZimbabwe

Linha do tempo:

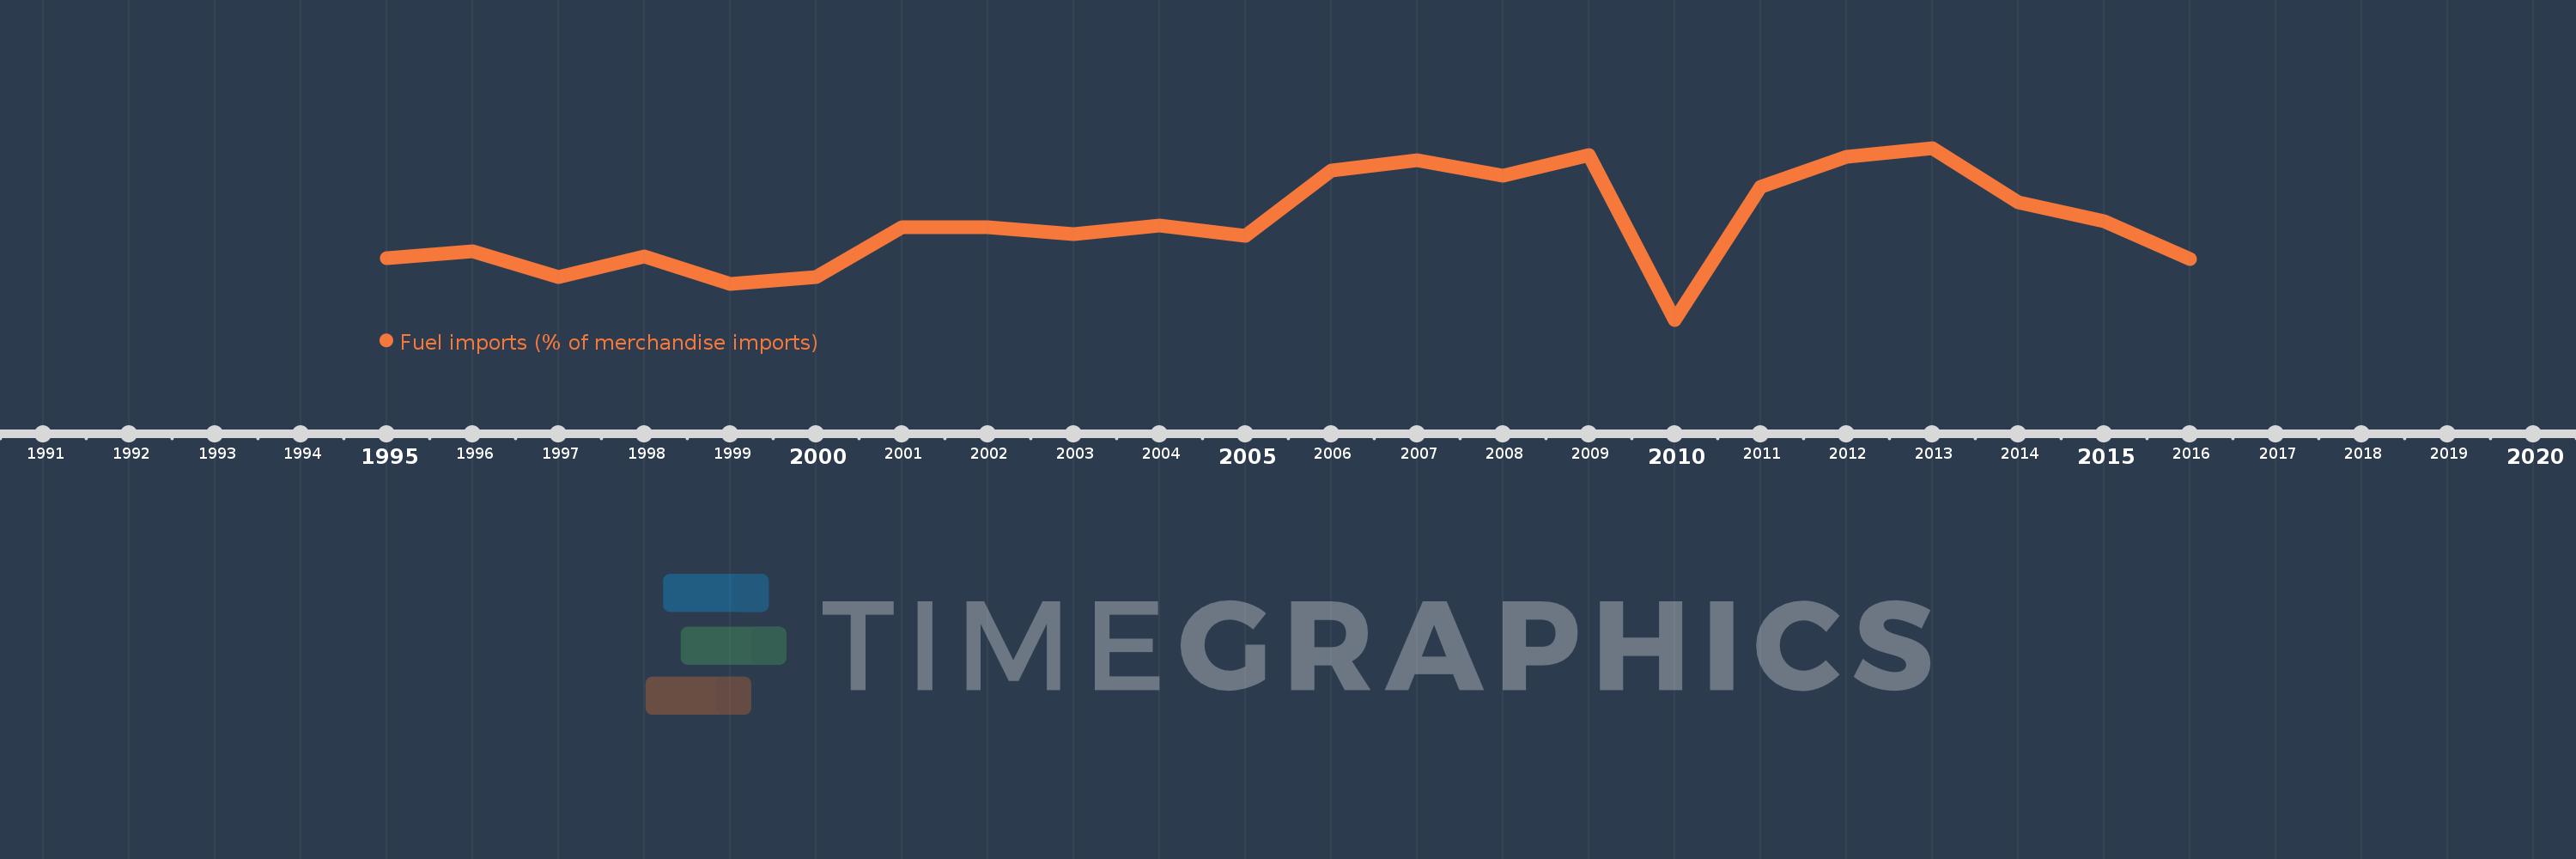
Nesta escala de tempo está apresentado um gráfico de 1995 ano até 2016 ano Macedonia, FYR. Dados de 1994 ano ausente. O número de observações reais por data: 22.

Fonte (nome):

Indicadores de desenvolvimento mundial

Fonte (organização):

World Bank staff estimates from the Comtrade database maintained by the United Nations Statistics Division.

Categorias:

Energy & Mining, Private Sector, Trade

Foi atualizado:

23 abr 2017 ano

Indicadores de alterações dos valores ao longo dos anos

Em média:
14.279
Mínimo:
5.193
1 jan 2010 ano
Máximo:
21.358
1 jan 2013 ano
Na data de observação
Valor
Mudança absoluta
A alteração em relação ao valor anterior
1 jan 1995 ano
10.969
+10.969
0.0%
1 jan 1996 ano
11.667
+0.698
6.36%
1 jan 1997 ano
9.231
-2.436
-20.88%
1 jan 1998 ano
11.119
+1.888
20.46%
1 jan 1999 ano
8.527
-2.592
-23.31%
1 jan 2000 ano
9.173
+0.646
7.57%
1 jan 2001 ano
13.872
+4.699
51.23%
1 jan 2002 ano
13.901
+0.029
0.21%
1 jan 2003 ano
13.251
-0.65
-4.68%
1 jan 2004 ano
14.06
+0.809
6.11%
1 jan 2005 ano
13.057
-1.002
-7.13%
1 jan 2006 ano
19.203
+6.145
47.06%
1 jan 2007 ano
20.241
+1.038
5.41%
1 jan 2008 ano
18.774
-1.466
-7.24%
1 jan 2009 ano
20.726
+1.951
10.39%
1 jan 2010 ano
5.193
-15.532
-74.94%
1 jan 2011 ano
17.7
+12.506
240.81%
1 jan 2012 ano
20.504
+2.805
15.85%
1 jan 2013 ano
21.358
+0.853
4.16%
1 jan 2014 ano
16.258
-5.1
-23.88%
1 jan 2015 ano
14.442
-1.816
-11.17%
1 jan 2016 ano
10.916
-3.526
-24.41%

Classificação de países por estatísticas atuais por anos