33
/pt/
AIzaSyB4mHJ5NPEv-XzF7P6NDYXjlkCWaeKw5bc
November 30, 2025
110926
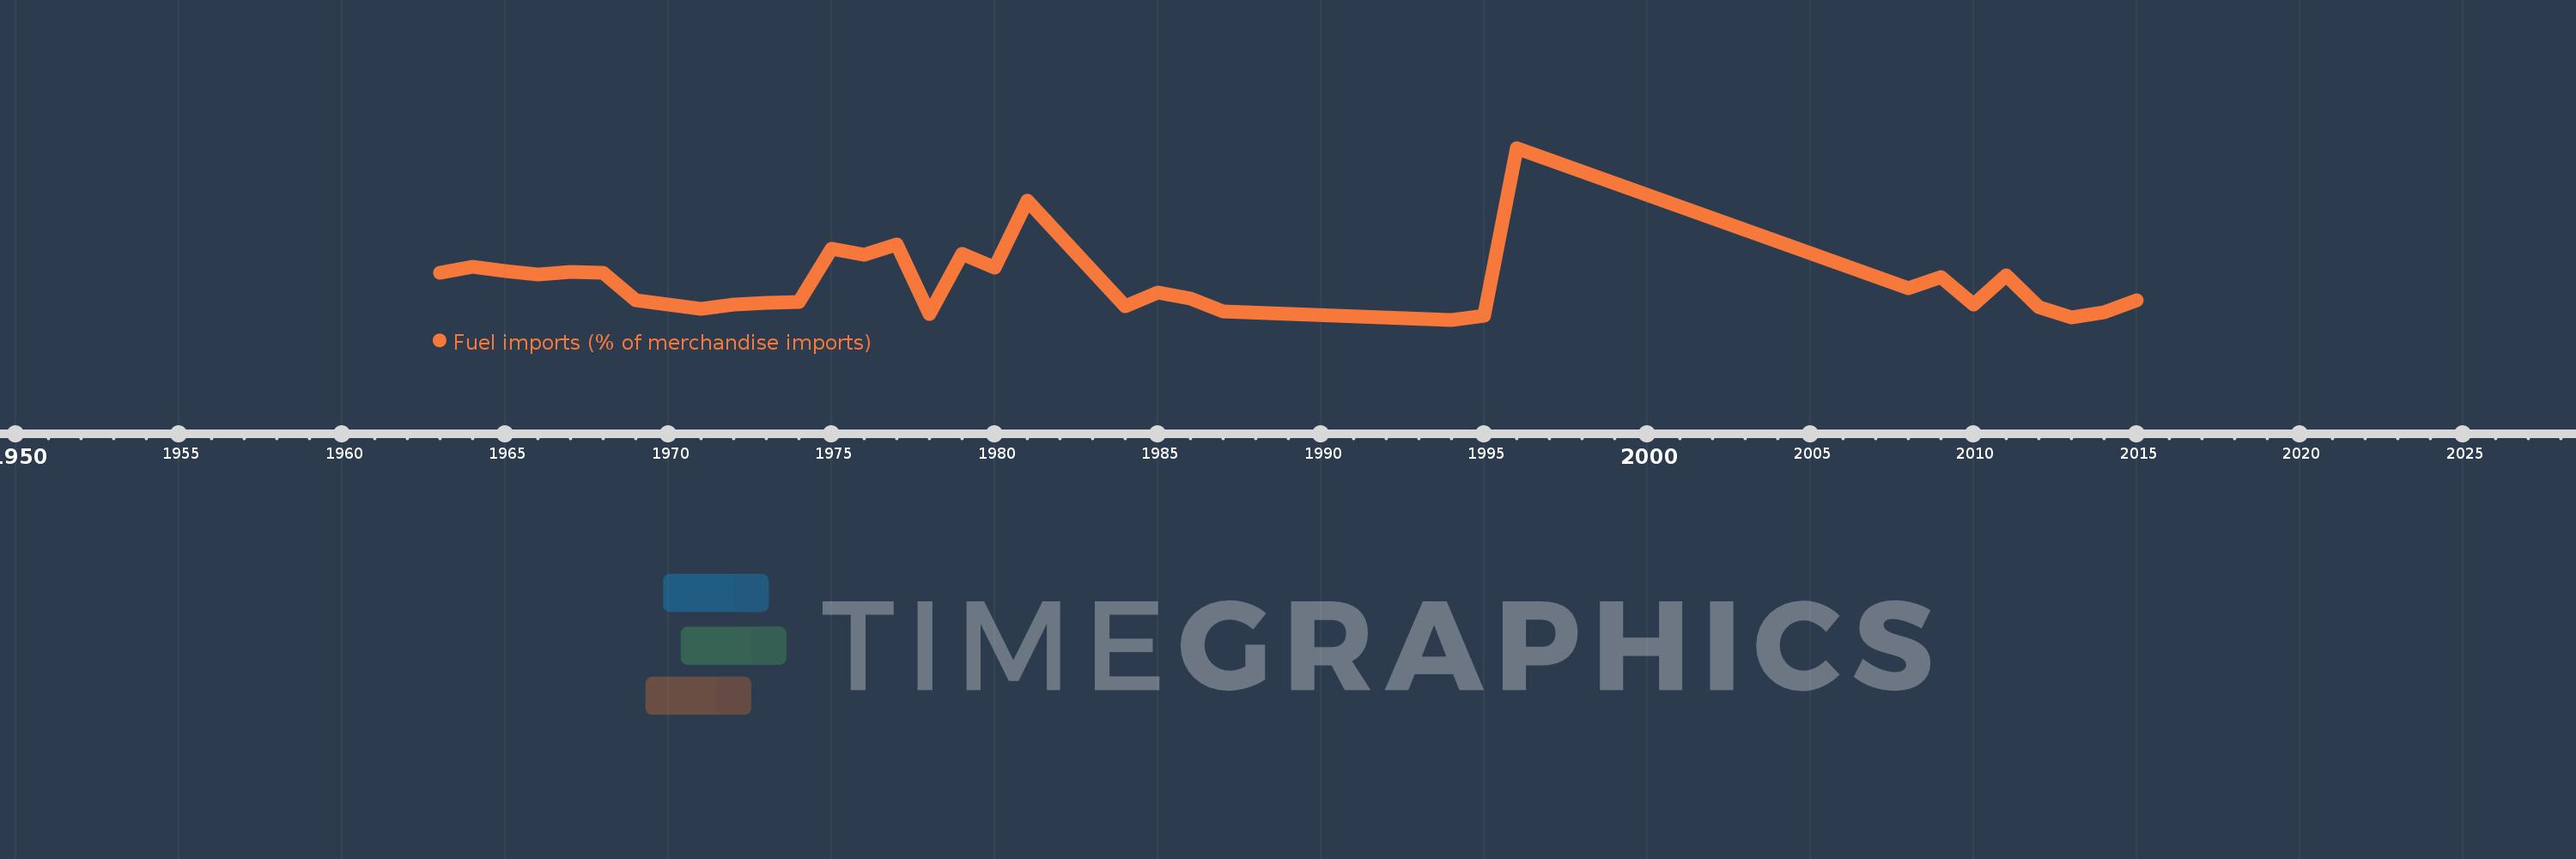
Congo, Rep.
COG
true
2
1
Fuel imports (% of merchandise imports)
2015,2014,2013,2012,2011,2010,2009,2008,1996,1995,1994,1987,1986,1985,1984,1981,1980,1979,1978,1977,1976,1975,1974,1973,1972,1971,1969,1968,1967,1966,1965,1964,1963