33
/pt/
AIzaSyAYiBZKx7MnpbEhh9jyipgxe19OcubqV5w
August 1, 2025
174904
Lao PDR
LAO
true
2
1
Trained teachers in preprimary education, female (% of female teachers)
2015,2014,2013,2012,2011,2010,2009,2008,2007,2006,2005,2004,2003,2002,2001,2000
Download
Biblioteca de estatísticas globais →Lao PDR →

Trained teachers in preprimary education, female (% of female teachers)

Estas estatísticas em outros países:

AndorraAngolaAntigua and BarbudaArab WorldArmeniaArubaAzerbaijanBahamas, TheBahrainBarbadosBelarusBelizeBeninBermudaBhutanBoliviaBotswanaBritish Virgin IslandsBrunei DarussalamBurkina FasoBurundiCabo VerdeCambodiaCameroonCaribbean small statesCayman IslandsChadColombiaCongo, Dem. Rep.Congo, Rep.Costa RicaCote d'IvoireCroatiaCubaDjiboutiDominicaDominican RepublicEcuadorEgypt, Arab Rep.El SalvadorEritreaEthiopiaFragile and conflict affected situationsGambia, TheGeorgiaGhanaGibraltarGrenadaGuineaGuinea-BissauGuyanaHeavily indebted poor countries (HIPC)HondurasIDA blendIDA onlyIDA totalIraqKazakhstanKenyaKuwaitKyrgyz RepublicLao PDRLeast developed countries: UN classificationLebanonLiberiaLow incomeMacao SAR, ChinaMadagascarMalaysiaMaldivesMaliMarshall IslandsMauritaniaMauritiusMiddle East & North AfricaMiddle East & North Africa (excluding high income)Middle East & North Africa (IDA & IBRD countries)MoldovaMongoliaMoroccoMyanmarNamibiaNauruNepalNicaraguaNigerOmanOther small statesPacific island small statesPanamaParaguayPre-demographic dividendQatarRwandaSamoaSao Tome and PrincipeSaudi ArabiaSenegalSerbiaSeychellesSierra LeoneSmall statesSolomon IslandsSouth AfricaSouth SudanSt. Kitts and NevisSt. LuciaSt. Vincent and the GrenadinesSub-Saharan Africa Sub-Saharan Africa (excluding high income)Sub-Saharan Africa (IDA & IBRD countries)SurinameSwazilandSyrian Arab RepublicTajikistanTanzaniaTogoTongaTrinidad and TobagoTuvaluUnited Arab EmiratesUzbekistanVietnamWest Bank and GazaZimbabwe

Linha do tempo:

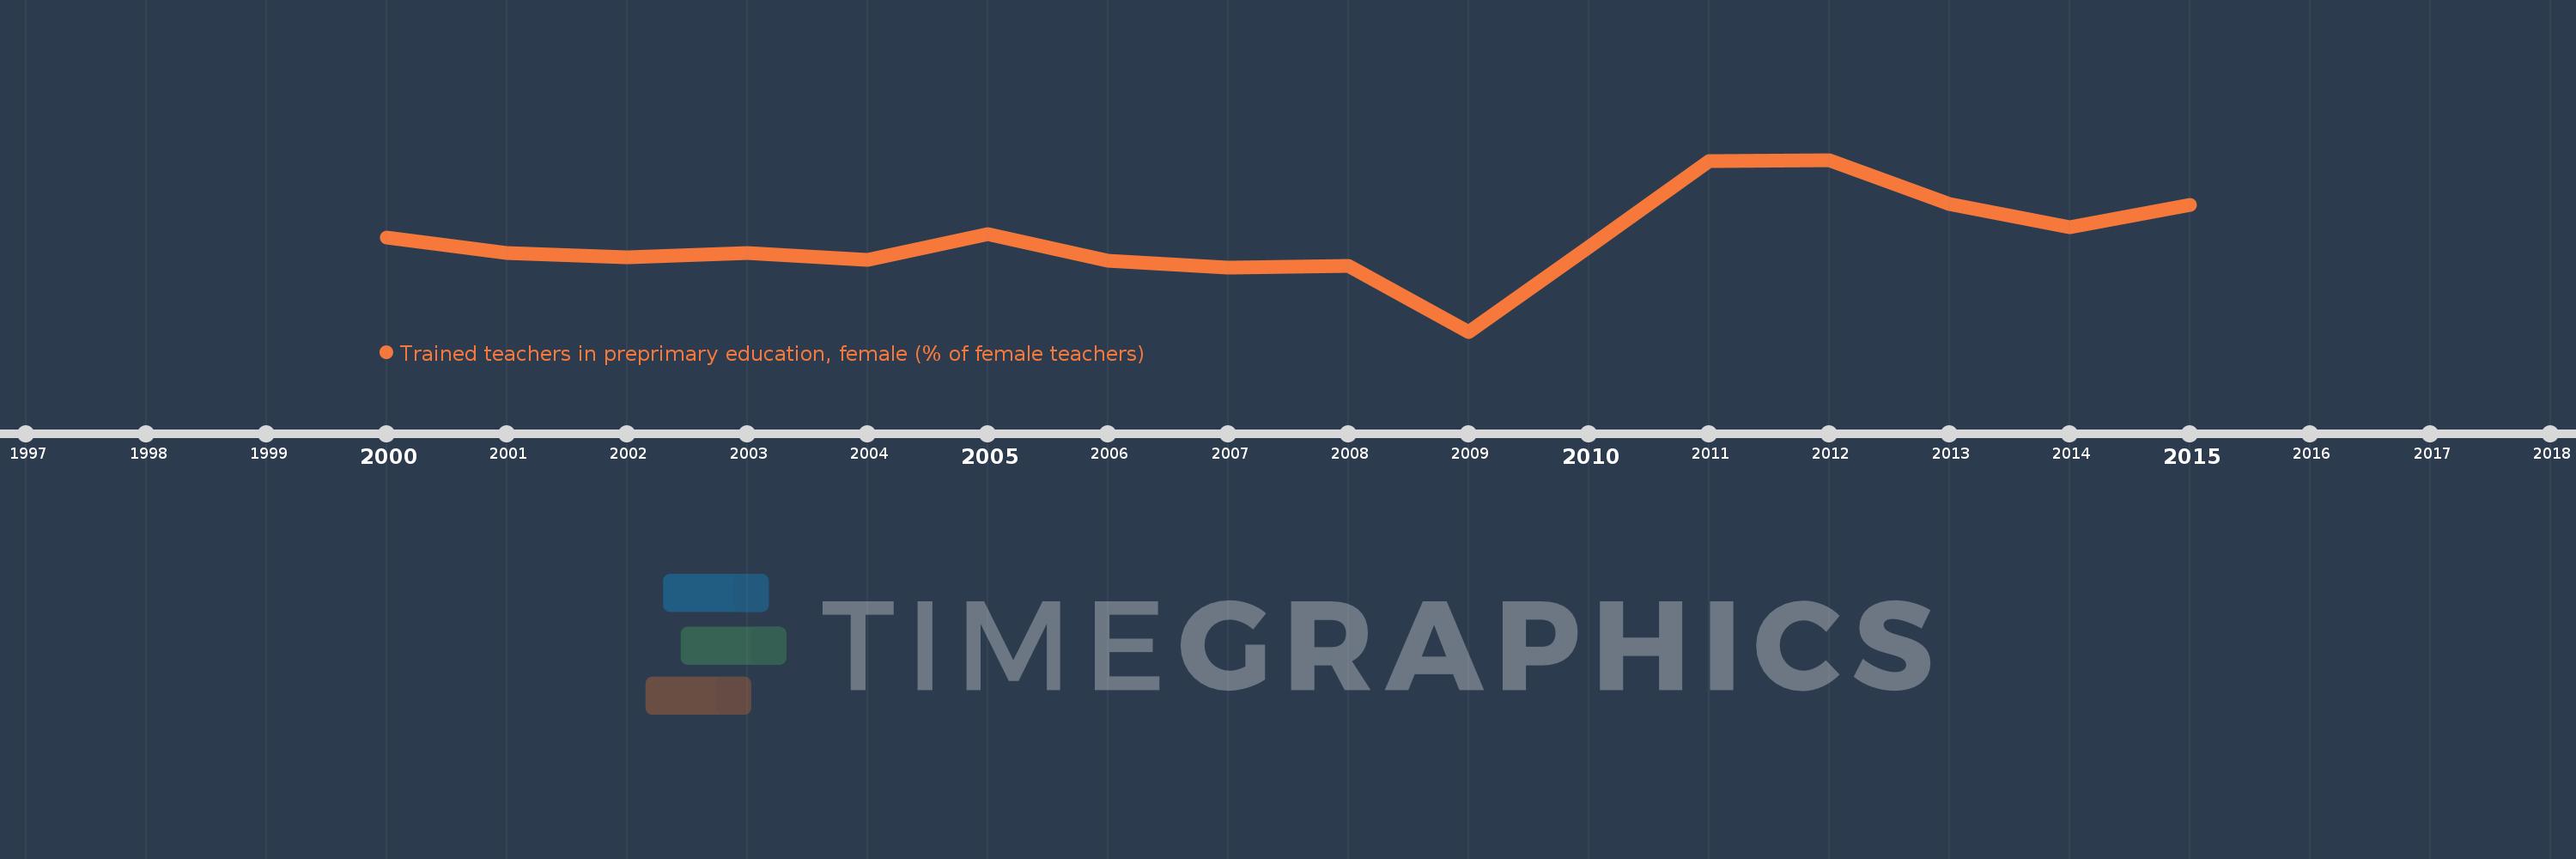
Nesta escala de tempo está apresentado um gráfico de 2000 ano até 2015 ano Lao PDR. Dados de 1999 ano ausente. O número de observações reais por data: 16.

Fonte (nome):

Indicadores de desenvolvimento mundial

Fonte (organização):

United Nations Educational, Scientific, and Cultural Organization (UNESCO) Institute for Statistics.

Categorias:

Education

Foi atualizado:

23 abr 2017 ano

Indicadores de alterações dos valores ao longo dos anos

Em média:
85.311
Mínimo:
70.894
1 jan 2009 ano
Máximo:
97.641
1 jan 2012 ano
Na data de observação
Valor
Mudança absoluta
A alteração em relação ao valor anterior
1 jan 2000 ano
85.551
+85.551
0.0%
1 jan 2001 ano
83.083
-2.468
-2.88%
1 jan 2002 ano
82.468
-0.615
-0.74%
1 jan 2003 ano
83.156
+0.688
0.83%
1 jan 2004 ano
82.102
-1.054
-1.27%
1 jan 2005 ano
86.087
+3.984
4.85%
1 jan 2006 ano
81.901
-4.186
-4.86%
1 jan 2007 ano
80.827
-1.073
-1.31%
1 jan 2008 ano
81.153
+0.325
0.4%
1 jan 2009 ano
70.894
-10.259
-12.64%
1 jan 2010 ano
84.106
+13.212
18.64%
1 jan 2011 ano
97.455
+13.349
15.87%
1 jan 2012 ano
97.641
+0.186
0.19%
1 jan 2013 ano
90.763
-6.877
-7.04%
1 jan 2014 ano
87.194
-3.569
-3.93%
1 jan 2015 ano
90.593
+3.399
3.9%

Classificação de países por estatísticas atuais por anos