33
/pt/
AIzaSyAYiBZKx7MnpbEhh9jyipgxe19OcubqV5w
May 1, 2025
148692
Guyana
GUY
true
2
1
Trained teachers in preprimary education, female (% of female teachers)
2013,2012,2011,2010,2009,2008,2006,2004,2002,2001,2000
Download
Biblioteca de estatísticas globais →Guyana →

Trained teachers in preprimary education, female (% of female teachers)

Estas estatísticas em outros países:

AndorraAngolaAntigua and BarbudaArab WorldArmeniaArubaAzerbaijanBahamas, TheBahrainBarbadosBelarusBelizeBeninBermudaBhutanBoliviaBotswanaBritish Virgin IslandsBrunei DarussalamBurkina FasoBurundiCabo VerdeCambodiaCameroonCaribbean small statesCayman IslandsChadColombiaCongo, Dem. Rep.Congo, Rep.Costa RicaCote d'IvoireCroatiaCubaDjiboutiDominicaDominican RepublicEcuadorEgypt, Arab Rep.El SalvadorEritreaEthiopiaFragile and conflict affected situationsGambia, TheGeorgiaGhanaGibraltarGrenadaGuineaGuinea-BissauGuyanaHeavily indebted poor countries (HIPC)HondurasIDA blendIDA onlyIDA totalIraqKazakhstanKenyaKuwaitKyrgyz RepublicLao PDRLeast developed countries: UN classificationLebanonLiberiaLow incomeMacao SAR, ChinaMadagascarMalaysiaMaldivesMaliMarshall IslandsMauritaniaMauritiusMiddle East & North AfricaMiddle East & North Africa (excluding high income)Middle East & North Africa (IDA & IBRD countries)MoldovaMongoliaMoroccoMyanmarNamibiaNauruNepalNicaraguaNigerOmanOther small statesPacific island small statesPanamaParaguayPre-demographic dividendQatarRwandaSamoaSao Tome and PrincipeSaudi ArabiaSenegalSerbiaSeychellesSierra LeoneSmall statesSolomon IslandsSouth AfricaSouth SudanSt. Kitts and NevisSt. LuciaSt. Vincent and the GrenadinesSub-Saharan Africa Sub-Saharan Africa (excluding high income)Sub-Saharan Africa (IDA & IBRD countries)SurinameSwazilandSyrian Arab RepublicTajikistanTanzaniaTogoTongaTrinidad and TobagoTuvaluUnited Arab EmiratesUzbekistanVietnamWest Bank and GazaZimbabwe

Linha do tempo:

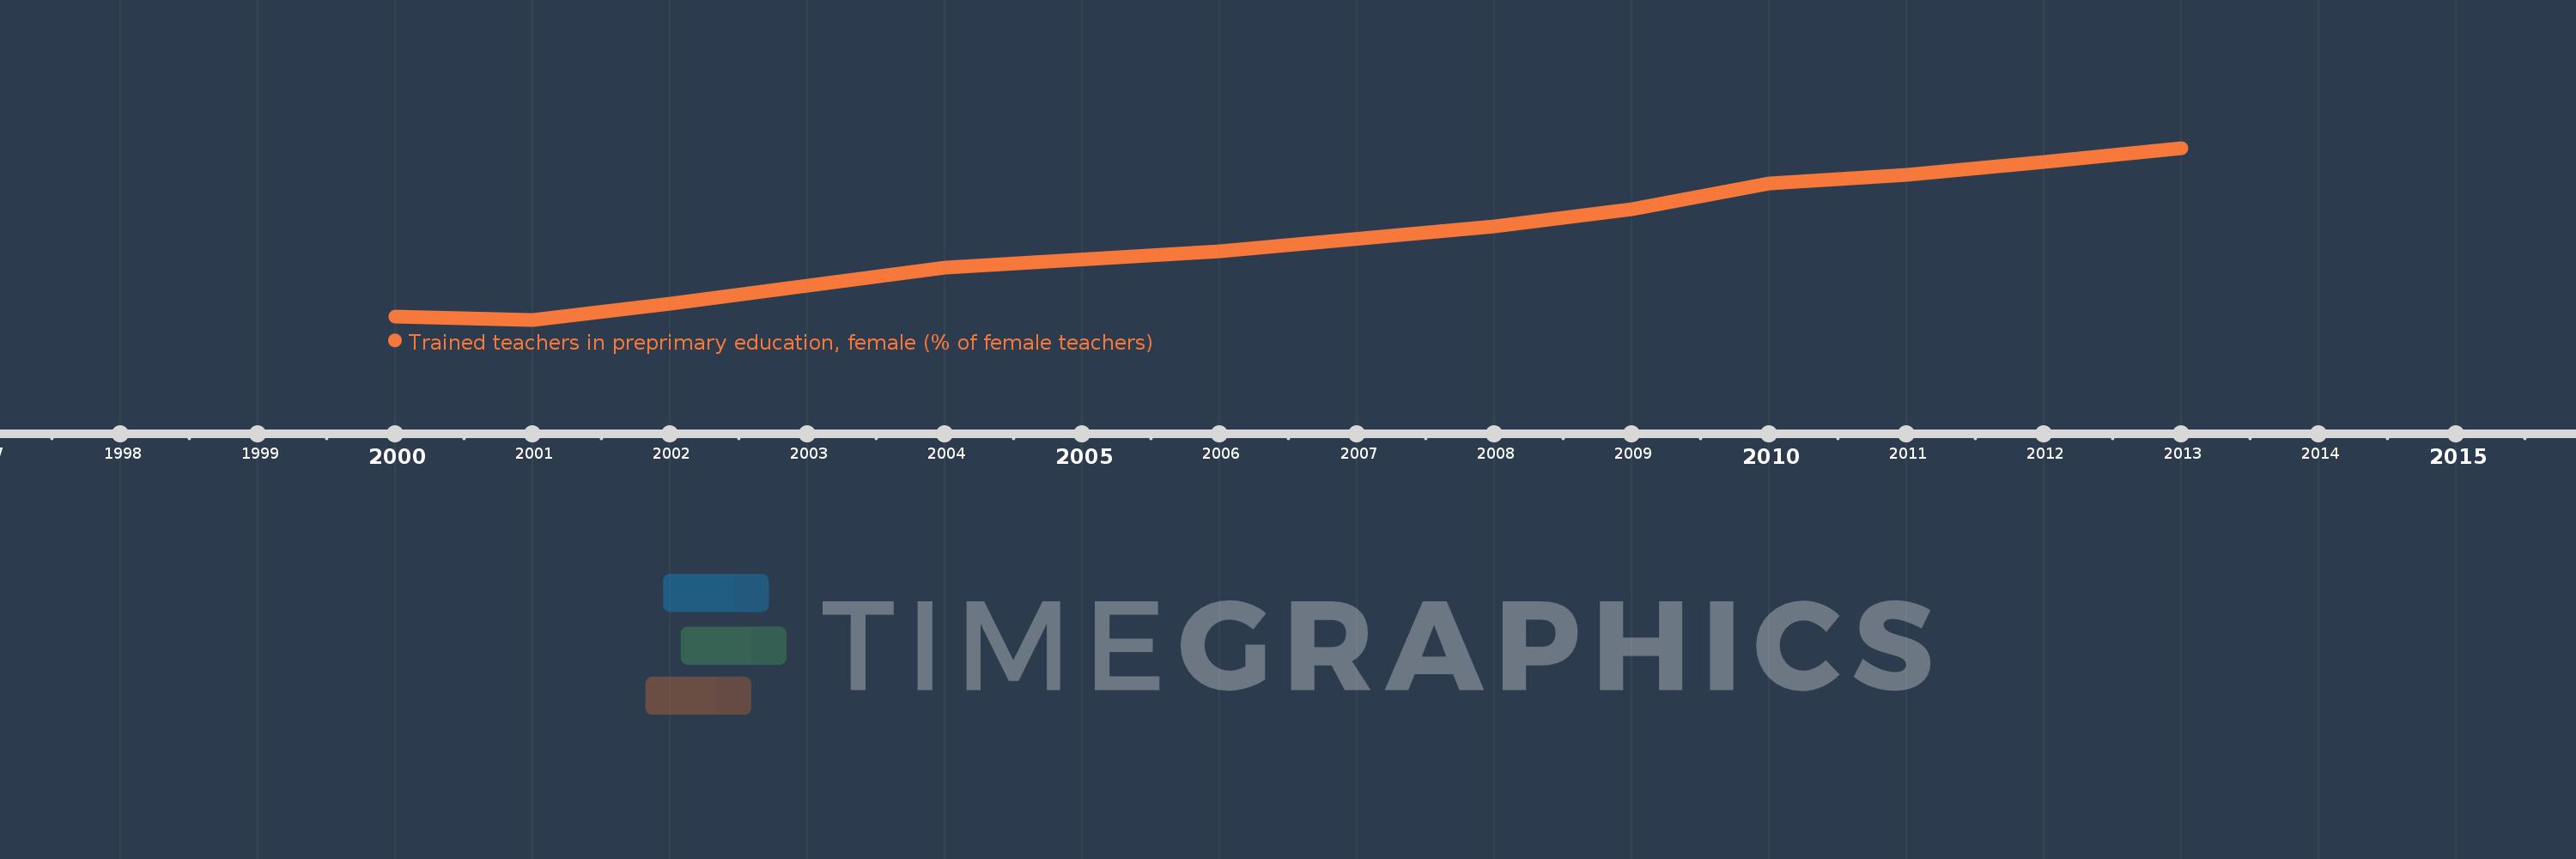
Nesta escala de tempo está apresentado um gráfico de 2000 ano até 2013 ano Guyana. Dados de 1999 ano ausente. O número de observações reais por data: 11.

Fonte (nome):

Indicadores de desenvolvimento mundial

Fonte (organização):

United Nations Educational, Scientific, and Cultural Organization (UNESCO) Institute for Statistics.

Categorias:

Education

Foi atualizado:

23 abr 2017 ano

Indicadores de alterações dos valores ao longo dos anos

Em média:
51.63
Mínimo:
37.818
1 jan 2001 ano
Máximo:
65.186
1 jan 2013 ano
Na data de observação
Valor
Mudança absoluta
A alteração em relação ao valor anterior
1 jan 2000 ano
38.328
+38.328
0.0%
1 jan 2001 ano
37.818
-0.51
-1.33%
1 jan 2002 ano
40.38
+2.562
6.77%
1 jan 2004 ano
46.14
+5.76
14.26%
1 jan 2006 ano
48.684
+2.544
5.51%
1 jan 2008 ano
52.629
+3.945
8.1%
1 jan 2009 ano
55.476
+2.847
5.41%
1 jan 2010 ano
59.473
+3.997
7.2%
1 jan 2011 ano
60.877
+1.404
2.36%
1 jan 2012 ano
62.937
+2.061
3.38%
1 jan 2013 ano
65.186
+2.248
3.57%

Classificação de países por estatísticas atuais por anos