33
/pt/
AIzaSyB4mHJ5NPEv-XzF7P6NDYXjlkCWaeKw5bc
November 1, 2025
137415
Gambia, The
GMB
true
2
1
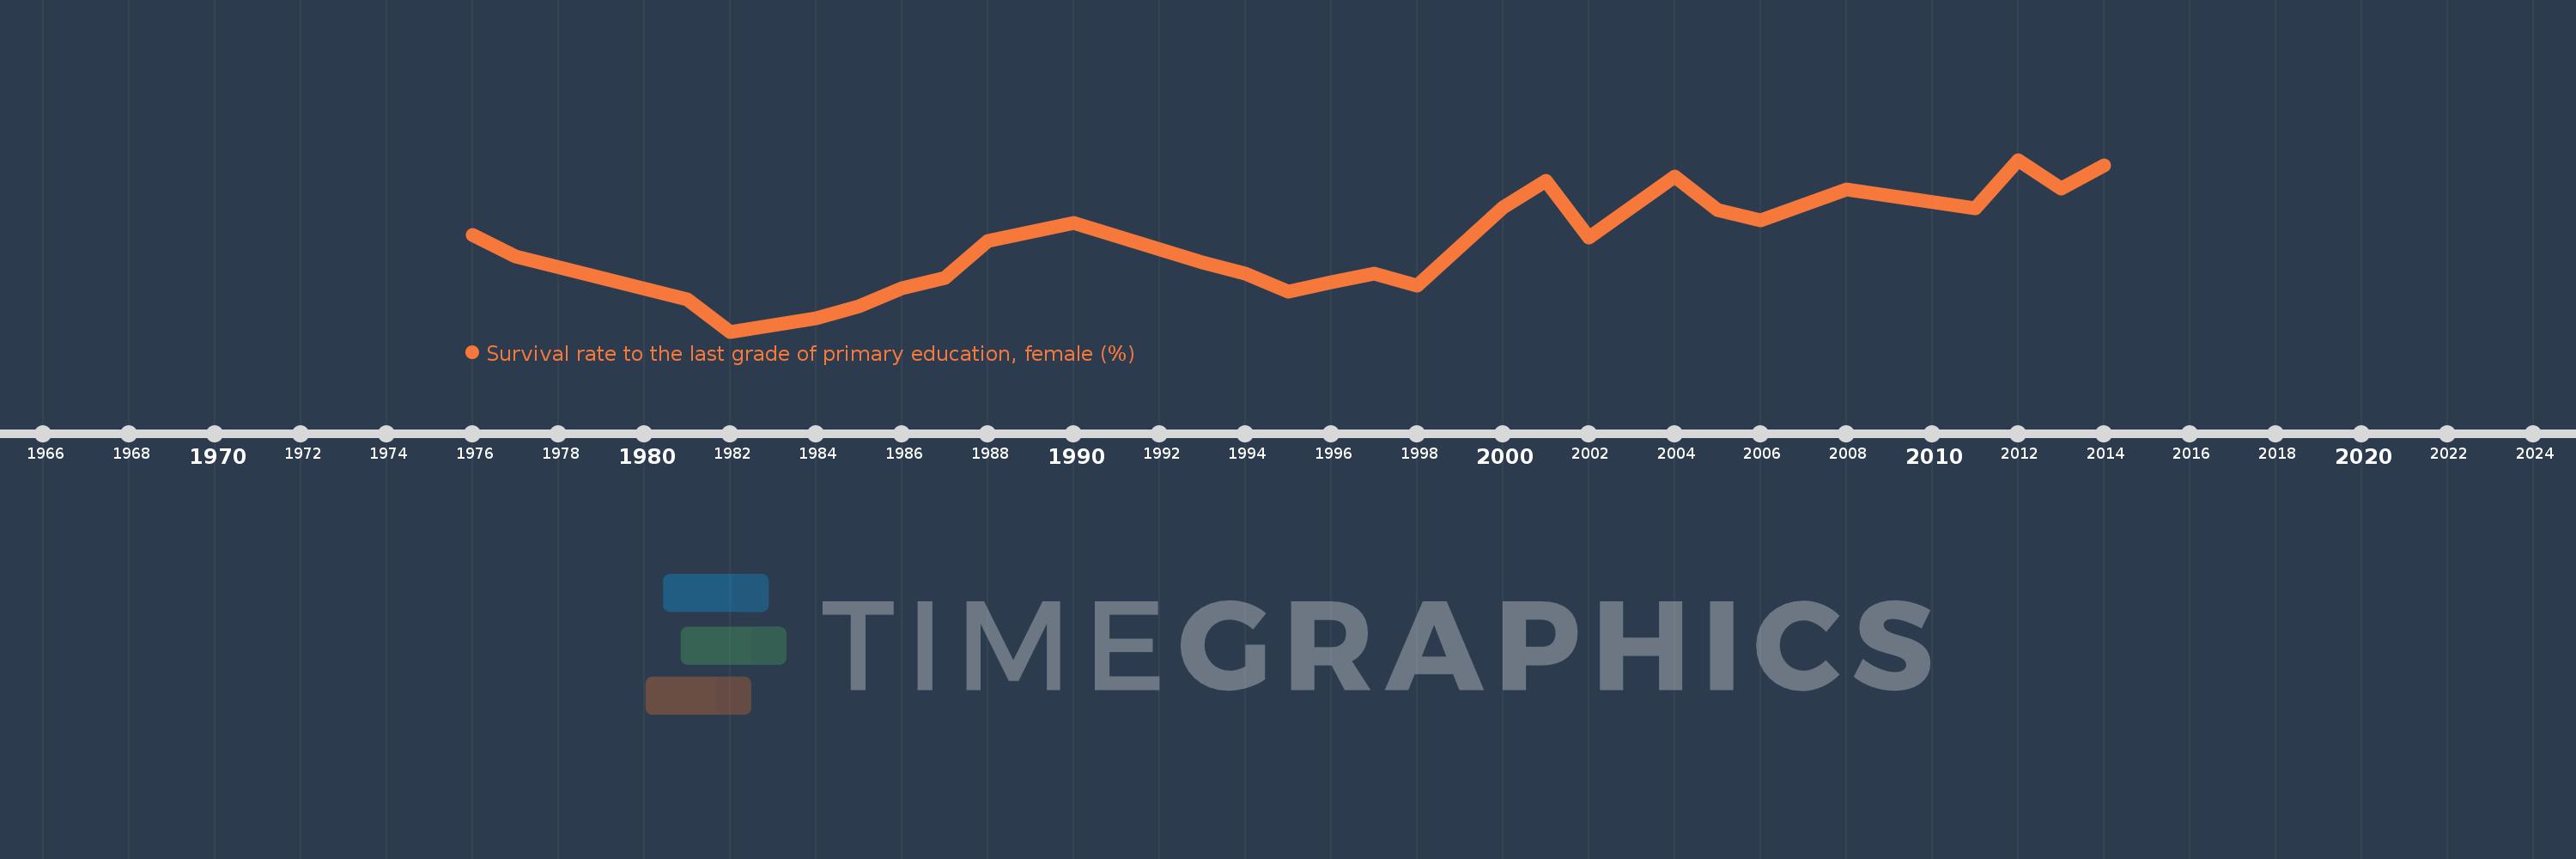
Survival rate to the last grade of primary education, female (%)
2014,2013,2012,2011,2008,2006,2005,2004,2002,2001,2000,1998,1997,1996,1995,1994,1993,1990,1988,1987,1986,1985,1984,1983,1982,1981,1977,1976