33
/pt/
AIzaSyB4mHJ5NPEv-XzF7P6NDYXjlkCWaeKw5bc
November 1, 2025
113019
Costa Rica
CRI
true
2
1
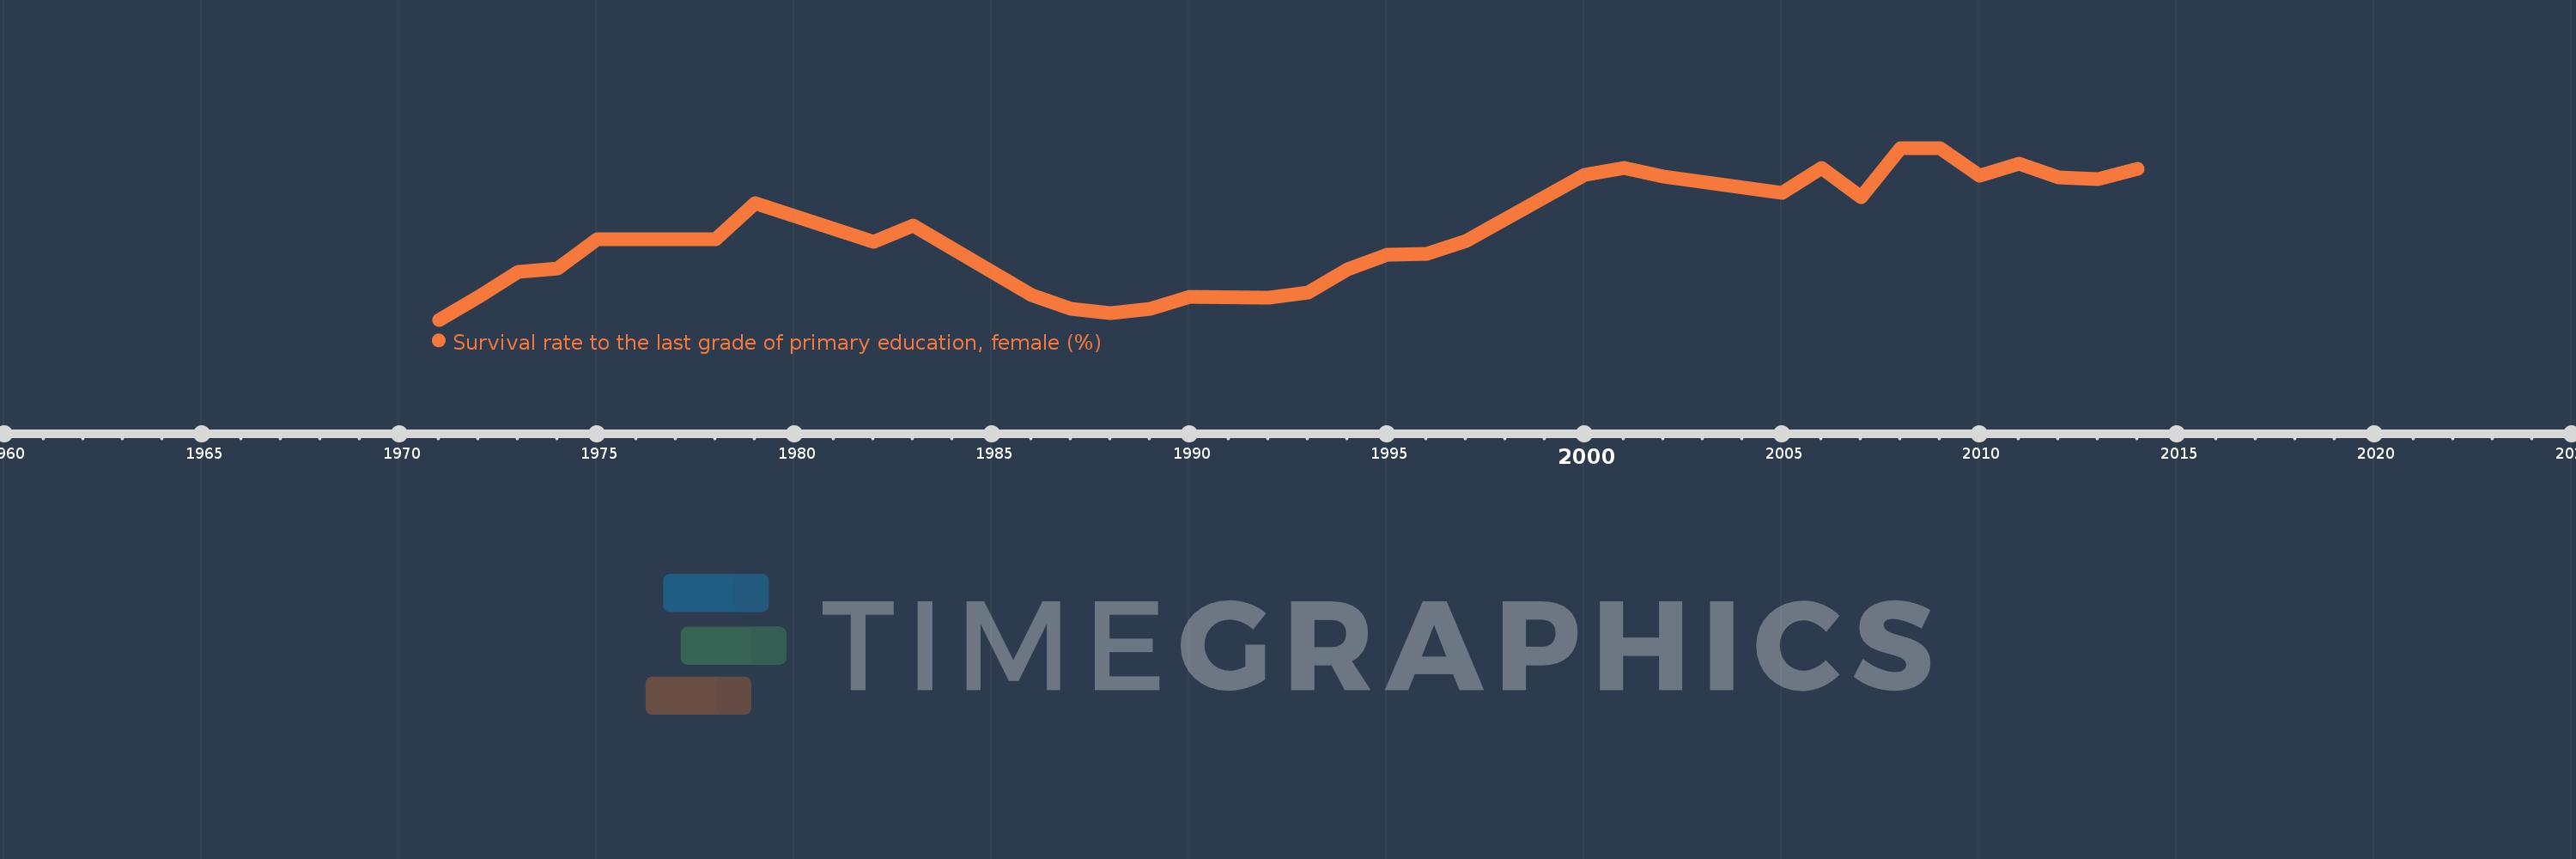
Survival rate to the last grade of primary education, female (%)
2014,2013,2012,2011,2010,2009,2008,2007,2006,2005,2002,2001,2000,1997,1996,1995,1994,1993,1992,1990,1989,1988,1987,1986,1983,1982,1979,1978,1975,1974,1973,1972,1971