33
/it/
AIzaSyAYiBZKx7MnpbEhh9jyipgxe19OcubqV5w
August 1, 2025
98746
Cambodia
KHM
true
2
1
Industry, value added (constant LCU)
2016,2015,2014,2013,2012,2011,2010,2009,2008,2007,2006,2005,2004,2003,2002,2001,2000,1999,1998,1997,1996,1995,1994
Download
Biblioteca di statistiche globali →Cambodia →

Industry, value added (constant LCU)

Queste statistiche in altri paesi:

AfghanistanAlbaniaAlgeriaAntigua and BarbudaArgentinaArmeniaAustraliaAustriaAzerbaijanBahamas, TheBahrainBangladeshBelarusBelgiumBelizeBeninBermudaBhutanBoliviaBosnia and HerzegovinaBotswanaBrazilBrunei DarussalamBulgariaBurkina FasoBurundiCabo VerdeCambodiaCameroonCanadaCayman IslandsCentral African RepublicChadChileChinaColombiaComorosCongo, Dem. Rep.Congo, Rep.Costa RicaCote d'IvoireCroatiaCubaCyprusCzech RepublicDenmarkDjiboutiDominicaDominican RepublicEcuadorEgypt, Arab Rep.El SalvadorEquatorial GuineaEritreaEstoniaEthiopiaFijiFinlandFranceGabonGambia, TheGeorgiaGermanyGhanaGreeceGrenadaGuatemalaGuineaGuinea-BissauGuyanaHaitiHondurasHong Kong SAR, ChinaHungaryIcelandIndiaIndonesiaIran, Islamic Rep.IraqIrelandItalyJamaicaJapanJordanKazakhstanKenyaKiribatiKorea, Rep.KosovoKuwaitKyrgyz RepublicLao PDRLatviaLebanonLesothoLiberiaLithuaniaLuxembourgMacedonia, FYRMadagascarMalawiMalaysiaMaldivesMaliMarshall IslandsMauritaniaMauritiusMexicoMicronesia, Fed. Sts.MoldovaMongoliaMontenegroMoroccoMozambiqueMyanmarNamibiaNepalNetherlandsNew ZealandNicaraguaNigerNigeriaNorwayOmanPakistanPalauPanamaPapua New GuineaParaguayPeruPhilippinesPolandPortugalPuerto RicoQatarRomaniaRussian FederationRwandaSamoaSao Tome and PrincipeSaudi ArabiaSenegalSerbiaSeychellesSierra LeoneSingaporeSlovak RepublicSloveniaSolomon IslandsSomaliaSouth AfricaSpainSri LankaSt. Kitts and NevisSt. LuciaSt. Vincent and the GrenadinesSudanSurinameSwazilandSwedenSwitzerlandSyrian Arab RepublicTajikistanTanzaniaThailandTimor-LesteTogoTongaTrinidad and TobagoTunisiaTurkeyTurkmenistanTuvaluUgandaUkraineUnited Arab EmiratesUnited KingdomUnited StatesUruguayUzbekistanVanuatuVenezuela, RBVietnamWest Bank and GazaZambiaZimbabwe

Linea del tempo:

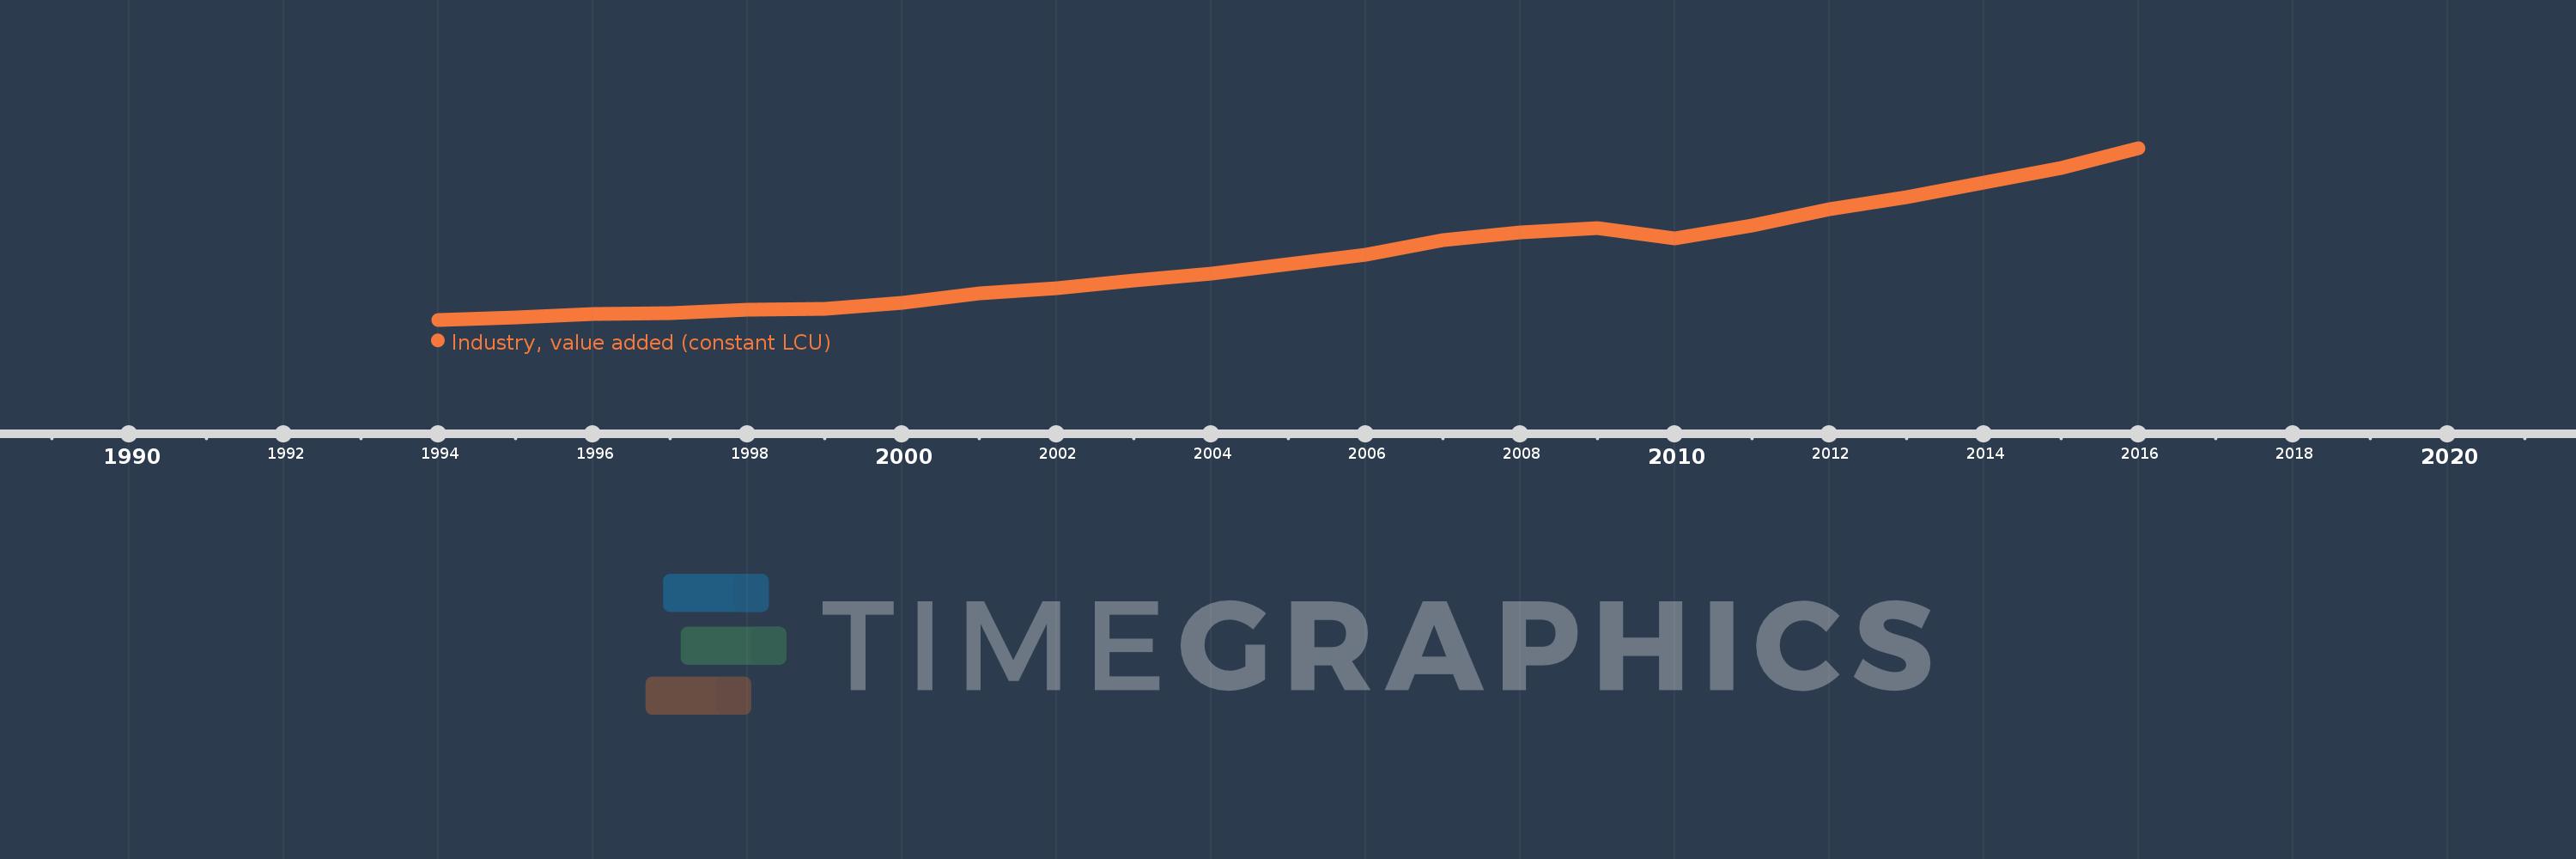
Questa scala temporale mostra un grafico dal 1994 anno al 2016 anno. Cambodia. I dati fino ad 1993 anno non disponibili. Il numero di osservazioni attuali secondo i date: 23.

La fonte (nome):

Indicatori dello sviluppo mondiale

La fonte (organizzazione):

World Bank national accounts data, and OECD National Accounts data files.

Categorie:

Economy & Growth

sono stati aggiornati

23 apr 2017 anni

Indicatori delle variazioni dei valori per anni

In media:
5.74 Trln
Minima:
1.101 Trln
1 gen 1994 anni
Massimo:
13.788 Trln
1 gen 2016 anni
Alla data di osservazione
Valore
Variazione assoluta
La variazione rispetto al valore precedente
1 gen 1994 anni
1.101 Trln
+1.101 Trln
0.0%
1 gen 1995 anni
1.257 Trln
+156.403 Mlrd
14.21%
1 gen 1996 anni
1.495 Trln
+237.719 Mlrd
18.91%
1 gen 1997 anni
1.561 Trln
+65.567 Mlrd
4.39%
1 gen 1998 anni
1.823 Trln
+262.355 Mlrd
16.81%
1 gen 1999 anni
1.936 Trln
+113.156 Mlrd
6.21%
1 gen 2000 anni
2.346 Trln
+410.171 Mlrd
21.19%
1 gen 2001 anni
3.078 Trln
+731.758 Mlrd
31.19%
1 gen 2002 anni
3.423 Trln
+344.704 Mlrd
11.2%
1 gen 2003 anni
4.007 Trln
+584.203 Mlrd
17.07%
1 gen 2004 anni
4.49 Trln
+482.695 Mlrd
12.05%
1 gen 2005 anni
5.235 Trln
+745.482 Mlrd
16.6%
1 gen 2006 anni
5.9 Trln
+664.574 Mlrd
12.69%
1 gen 2007 anni
6.977 Trln
+1.078 Trln
18.27%
1 gen 2008 anni
7.564 Trln
+586.438 Mlrd
8.4%
1 gen 2009 anni
7.87 Trln
+305.901 Mlrd
4.04%
1 gen 2010 anni
7.123 Trln
-747.098 Mlrd
-9.49%
1 gen 2011 anni
8.088 Trln
+965.555 Mlrd
13.56%
1 gen 2012 anni
9.259 Trln
+1.171 Trln
14.48%
1 gen 2013 anni
10.124 Trln
+864.512 Mlrd
9.34%
1 gen 2014 anni
11.235 Trln
+1.111 Trln
10.97%
1 gen 2015 anni
12.341 Trln
+1.106 Trln
9.84%
1 gen 2016 anni
13.788 Trln
+1.447 Trln
11.73%

Classificazione dei paesi secondo i statistiche attuali per anni