29
/it/
it
AIzaSyAYiBZKx7MnpbEhh9jyipgxe19OcubqV5w
April 1, 2024
98520
Cambodia
KHM
true
2
1
Exports of goods and services (constant LCU)
2016,2015,2014,2013,2012,2011,2010,2009,2008,2007,2006,2005,2004,2003,2002,2001,2000,1999,1998,1997,1996,1995,1994
Download
Biblioteca di statistiche globali →Cambodia →

Exports of goods and services (constant LCU)

Queste statistiche in altri paesi:
AlbaniaAlgeriaAngolaAntigua and BarbudaArgentinaArmeniaAustraliaAustriaAzerbaijanBahamas, TheBahrainBangladeshBarbadosBelarusBelgiumBelizeBeninBhutanBoliviaBosnia and HerzegovinaBotswanaBrazilBrunei DarussalamBulgariaBurkina FasoBurundiCabo VerdeCambodiaCameroonCanadaChadChileColombiaComorosCongo, Dem. Rep.Congo, Rep.Costa RicaCote d'IvoireCroatiaCubaCyprusCzech RepublicDenmarkDjiboutiDominican RepublicEcuadorEgypt, Arab Rep.El SalvadorEquatorial GuineaEritreaEstoniaEthiopiaFijiFinlandFranceGabonGambia, TheGeorgiaGermanyGhanaGreeceGuatemalaGuineaGuinea-BissauHaitiHondurasHong Kong SAR, ChinaHungaryIcelandIndiaIndonesiaIran, Islamic Rep.IrelandIsraelItalyJamaicaJapanJordanKazakhstanKenyaKorea, Rep.KosovoKuwaitKyrgyz RepublicLao PDRLatviaLebanonLiberiaLibyaLithuaniaLuxembourgMacao SAR, ChinaMacedonia, FYRMadagascarMalawiMalaysiaMaliMaltaMauritaniaMauritiusMexicoMoldovaMongoliaMontenegroMoroccoMozambiqueMyanmarNamibiaNepalNetherlandsNew ZealandNicaraguaNigerNigeriaNorwayOmanPakistanPanamaPapua New GuineaParaguayPeruPhilippinesPolandPortugalPuerto RicoQatarRomaniaRussian FederationRwandaSamoaSaudi ArabiaSenegalSerbiaSeychellesSierra LeoneSingaporeSlovak RepublicSloveniaSomaliaSouth AfricaSouth SudanSpainSri LankaSudanSurinameSwazilandSwedenSwitzerlandSyrian Arab RepublicTajikistanTanzaniaThailandTimor-LesteTogoTrinidad and TobagoTunisiaTurkeyTurkmenistanUgandaUkraineUnited Arab EmiratesUnited KingdomUnited StatesUruguayUzbekistanVanuatuVenezuela, RBVietnamWest Bank and GazaZambiaZimbabwe
Linea del tempo:
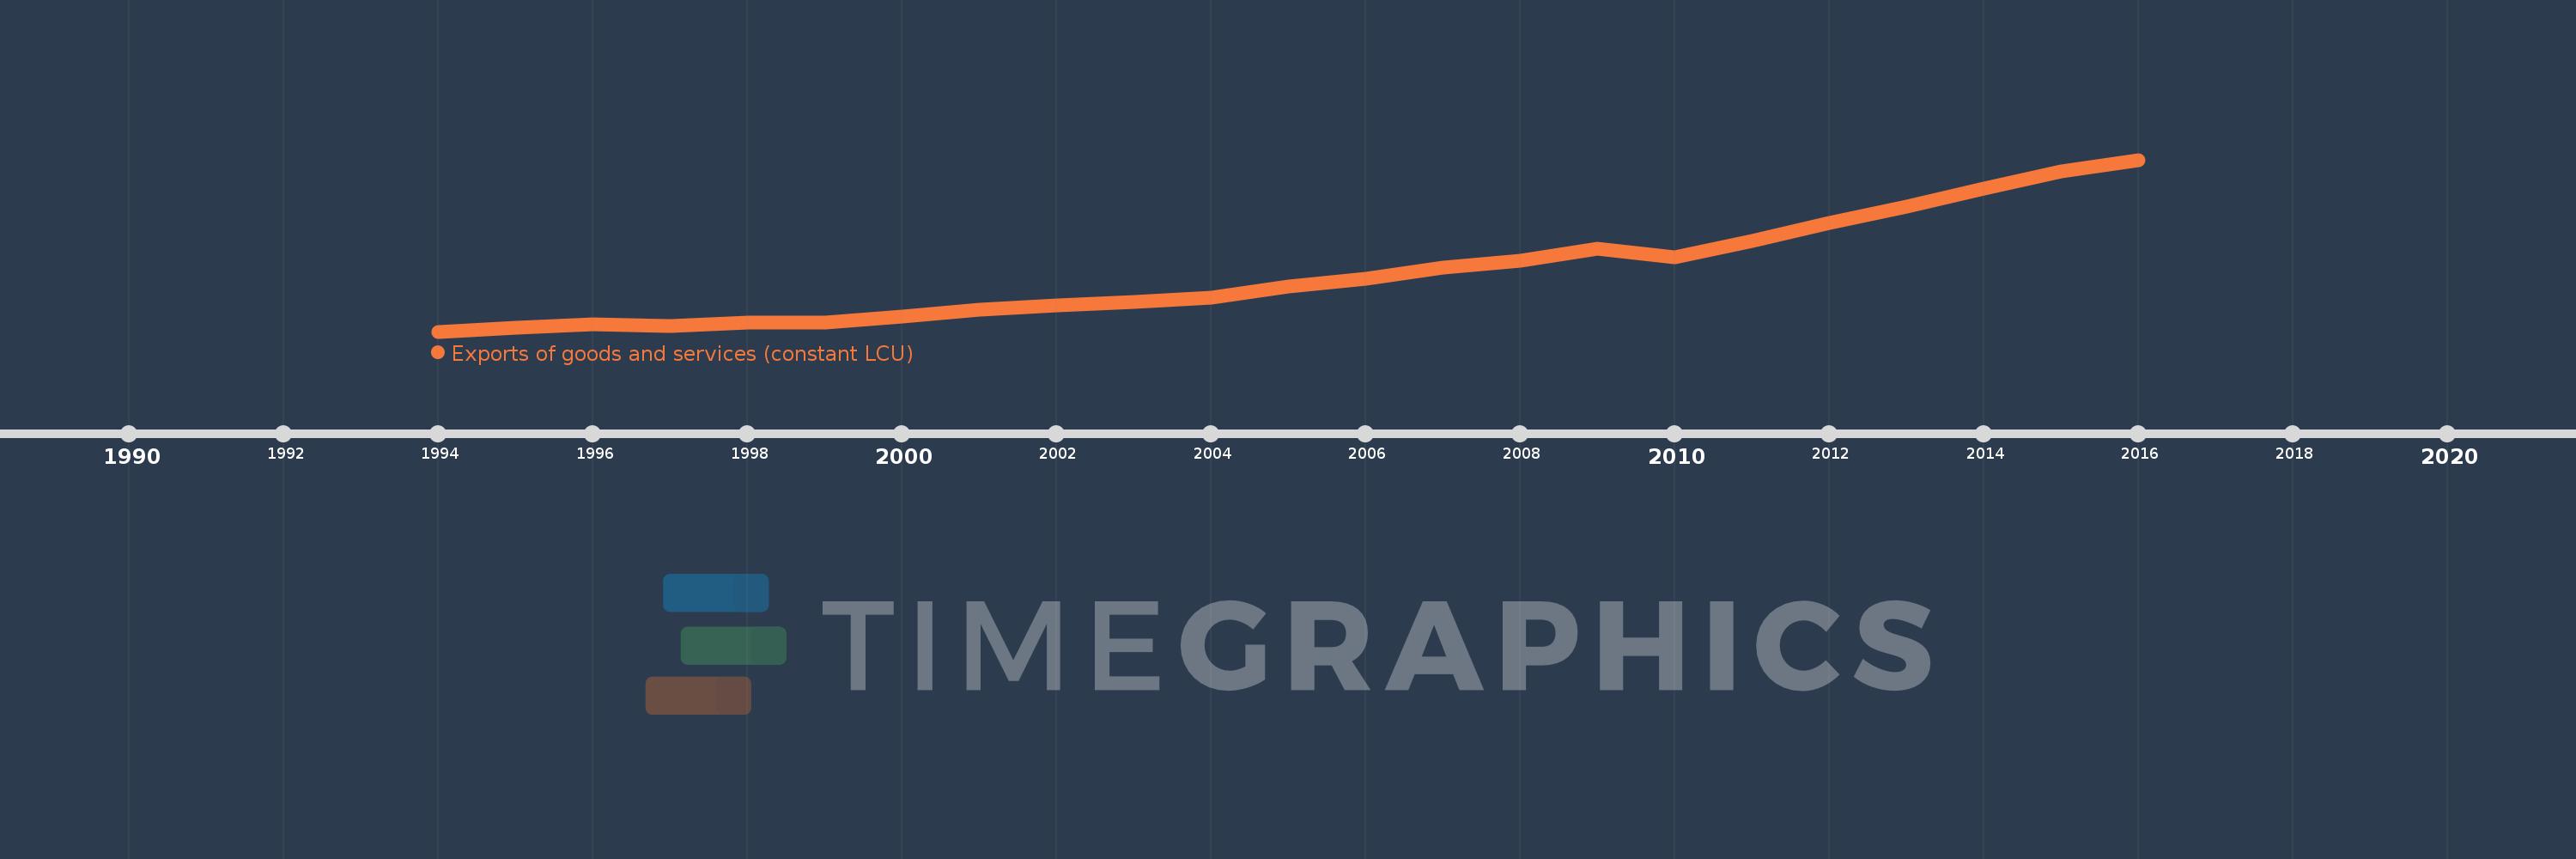
Questa scala temporale mostra un grafico dal 1994 anno al 2016 anno. Cambodia. I dati fino ad 1993 anno non disponibili. Il numero di osservazioni attuali secondo i date: 23.
La fonte (nome):
Indicatori dello sviluppo mondiale
La fonte (organizzazione):
World Bank national accounts data, and OECD National Accounts data files.
Categorie:
Economy & Growth
sono stati aggiornati
23 apr 2017 anni
Indicatori delle variazioni dei valori per anni
In media:
16.861 Trln
Minima:
1.323 Trln
1 gen 1994 anni
Massimo:
46.815 Trln
1 gen 2016 anni
Alla data di osservazione
Valore
Variazione assoluta
La variazione rispetto al valore precedente
1 gen 1994 anni
1.323 Trln
+1.323 Trln
0.0%
1 gen 1995 anni
2.298 Trln
+975.674 Mlrd
73.76%
1 gen 1996 anni
3.304 Trln
+1.006 Trln
43.76%
1 gen 1997 anni
2.727 Trln
-577.186 Mlrd
-17.47%
1 gen 1998 anni
3.712 Trln
+984.625 Mlrd
36.1%
1 gen 1999 anni
3.602 Trln
-109.888 Mlrd
-2.96%
1 gen 2000 anni
5.387 Trln
+1.786 Trln
49.58%
1 gen 2001 anni
7.02 Trln
+1.632 Trln
30.3%
1 gen 2002 anni
8.191 Trln
+1.172 Trln
16.69%
1 gen 2003 anni
9.259 Trln
+1.068 Trln
13.04%
1 gen 2004 anni
10.285 Trln
+1.026 Trln
11.08%
1 gen 2005 anni
13.174 Trln
+2.889 Trln
28.08%
1 gen 2006 anni
15.333 Trln
+2.159 Trln
16.39%
1 gen 2007 anni
18.275 Trln
+2.942 Trln
19.19%
1 gen 2008 anni
20.129 Trln
+1.854 Trln
10.15%
1 gen 2009 anni
23.281 Trln
+3.151 Trln
15.66%
1 gen 2010 anni
20.984 Trln
-2.297 Trln
-9.87%
1 gen 2011 anni
25.298 Trln
+4.315 Trln
20.56%
1 gen 2012 anni
30.076 Trln
+4.777 Trln
18.88%
1 gen 2013 anni
34.414 Trln
+4.338 Trln
14.42%
1 gen 2014 anni
39.24 Trln
+4.826 Trln
14.02%
1 gen 2015 anni
43.666 Trln
+4.426 Trln
11.28%
1 gen 2016 anni
46.815 Trln
+3.149 Trln
7.21%
Classificazione dei paesi secondo i statistiche attuali per anni

Commenti:

Inviare
PremiumAbout & FeedbackAccordoPrivatezza
logo
© 2022 Selected Technologies LLC – Morgan Hill, California