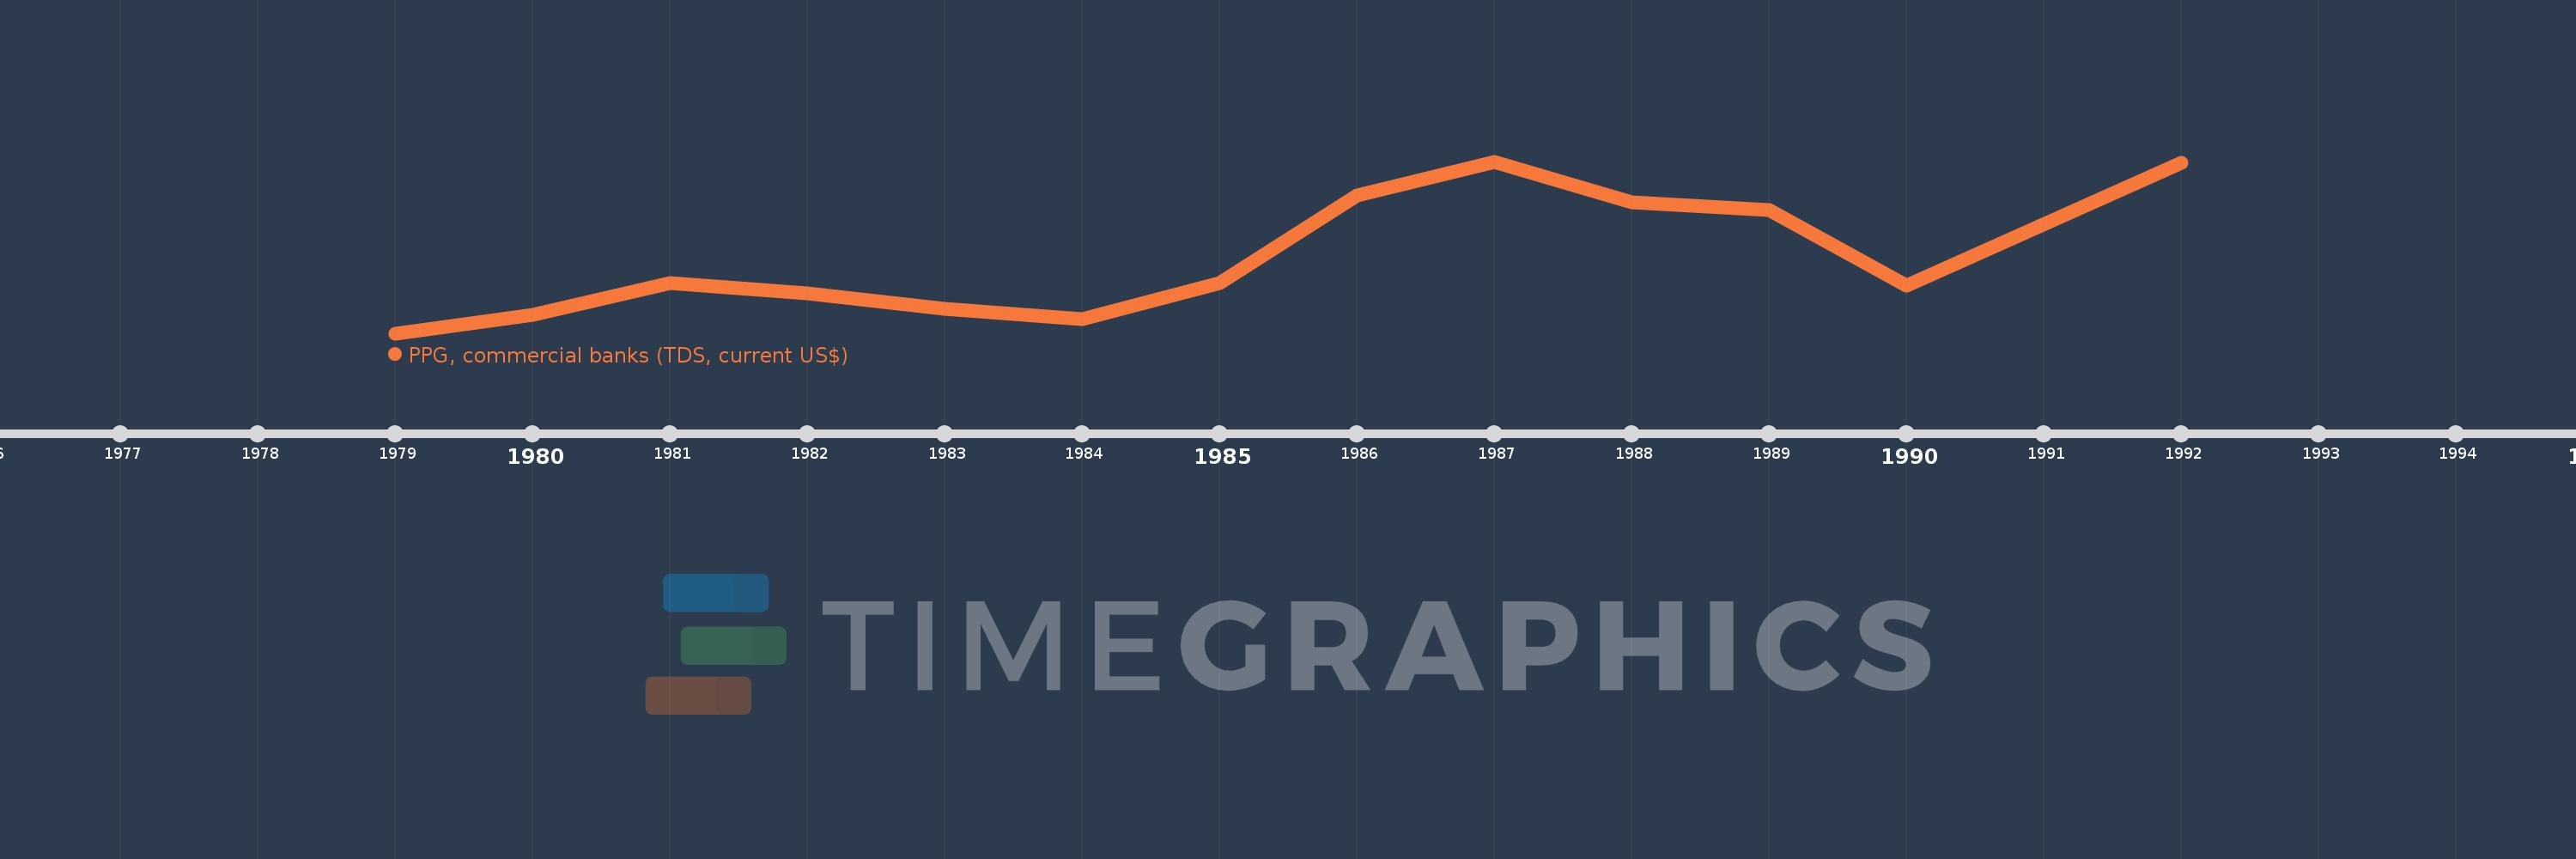
Questa scala temporale mostra un grafico dal 1979 anno al 1992 anno. Burkina Faso. I dati fino ad 1978 anno non disponibili. Il numero di osservazioni attuali secondo i date: 13.
La fonte (nome):
Indicatori dello sviluppo mondiale
La fonte (organizzazione):
World Bank, International Debt Statistics.
Categorie:
External Debt
sono stati aggiornati
23 apr 2017 anni
Indicatori delle variazioni dei valori per anni
In media:
343.077 Mille.
Minima:
84.0 Mille.
1 gen 1979 anni
Massimo:
675.0 Mille.
1 gen 1987 anni
Alla data di osservazione
Valore
Variazione assoluta
La variazione rispetto al valore precedente
1 gen 1979 anni
84.0 Mille.
+84.0 Mille.
0.0%
1 gen 1980 anni
149.0 Mille.
+65.0 Mille.
77.38%
1 gen 1981 anni
256.0 Mille.
+107.0 Mille.
71.81%
1 gen 1982 anni
221.0 Mille.
-35.0 Mille.
-13.67%
1 gen 1983 anni
168.0 Mille.
-53.0 Mille.
-23.98%
1 gen 1984 anni
133.0 Mille.
-35.0 Mille.
-20.83%
1 gen 1985 anni
256.0 Mille.
+123.0 Mille.
92.48%
1 gen 1986 anni
558.0 Mille.
+302.0 Mille.
117.97%
1 gen 1987 anni
675.0 Mille.
+117.0 Mille.
20.97%
1 gen 1988 anni
534.0 Mille.
-141.0 Mille.
-20.89%
1 gen 1989 anni
509.0 Mille.
-25.0 Mille.
-4.68%
1 gen 1990 anni
247.0 Mille.
-262.0 Mille.
-51.47%
1 gen 1992 anni
670.0 Mille.
+423.0 Mille.
171.26%
Classificazione dei paesi secondo i statistiche attuali per anni